|
||
|
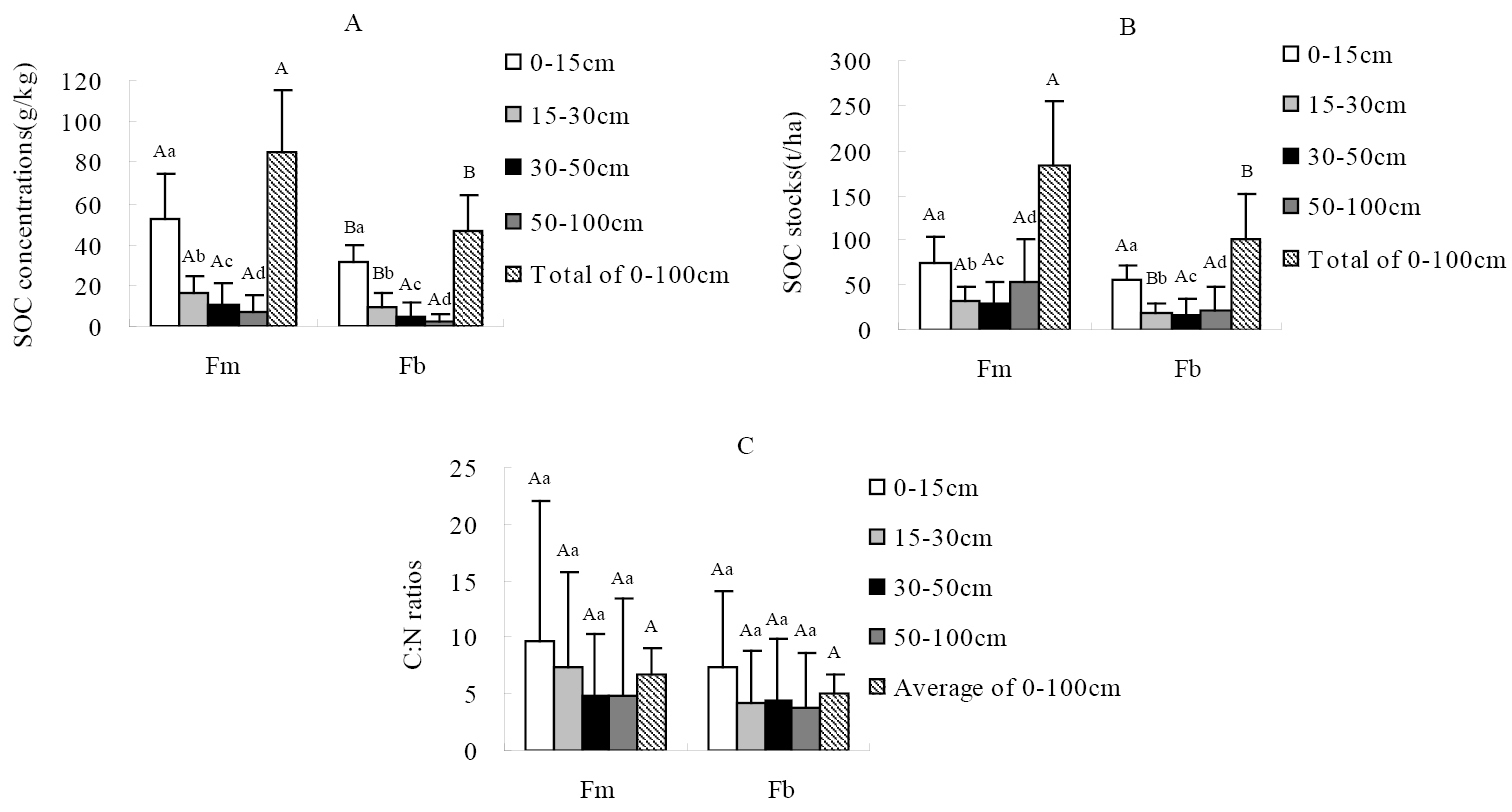
SOC concentrations (Fig. 1A), SOC stocks (Fig. 1B) and C:N ratios (Fig. 1C) of Fm and Fb. Where solid columns of different colors respectively show average values of each single horizon under the Fm and Fb. The columns with oblique lines are mean values of total SOC concentrations, total SOC stocks and average C:N ratios of 0-100 cm soil in Fm and Fb separately. Letters above each error bar indicate the statistical difference. The different capital letters show significant difference between value series of two forests (p<0.05), for example, capital letters on top of the two white columns (A and B) show difference between average 0–15 cm SOC concentrations of Fm and Fb. The different lowercase letters present remarkably differences of values among different soil horizons within a studied forest (p<0.001), for example, differences among SOC concentrations of 0–15 cm, 15–30 cm, 30–50 cm and 50–100 cm horizon of Fm were significant according to “a, b, c and d”. |