|
||
|
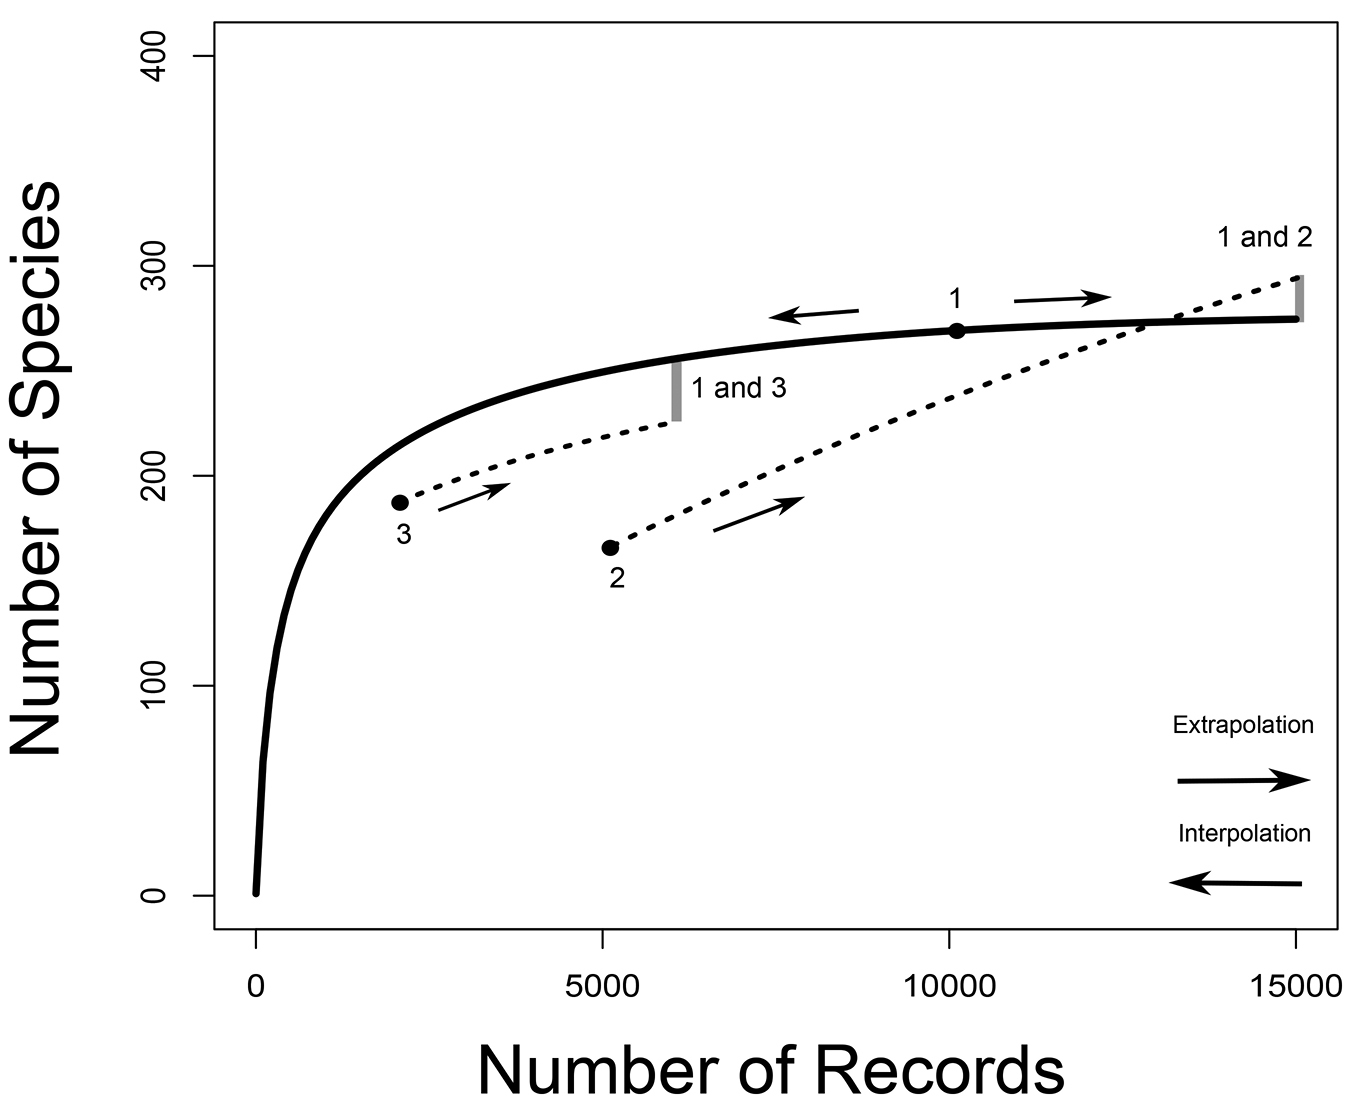
Species accumulation curves. Species richness is the asymptote of a species accumulation curve, which expresses the dependence on sampling effort of the number of species sampled from an assemblage. In CA2013, sampling effort is given by the number of records from which the number of species is calculated. For illustrative purposes, an example with three arbitrary samples (for 10000, 5000 and 2000 records, labeled from one to three) is drawn. For sample one, a predicted species accumulation curve is added that gradually increases from one species sampled to the predicted species richness for that assemblage (full line). Such curves are constructed on the basis of interpolation and extrapolation. For samples two and three only segments of extrapolated curves are drawn (dotted lines). For sample two, a curve that crosses the species accumulation curve of sample one is sketched. For samples one and three species accumulation curves are more or less proportional. The way in which the species richness differences between samples are assessed in CA2013 is illustrated by indicating on the species accumulation curves at which numbers of records pairwise comparisons would be made between two sample pairs (1 vs. 2 and 1 vs. 3). The number of species of the sample with the smallest number of records is extrapolated to the number expected at three times the number of records. When the number of records of the other sample is still larger than that, the number of species of the second sample is interpolated (rarefied), otherwise it is extrapolated as well. |