|
||
|
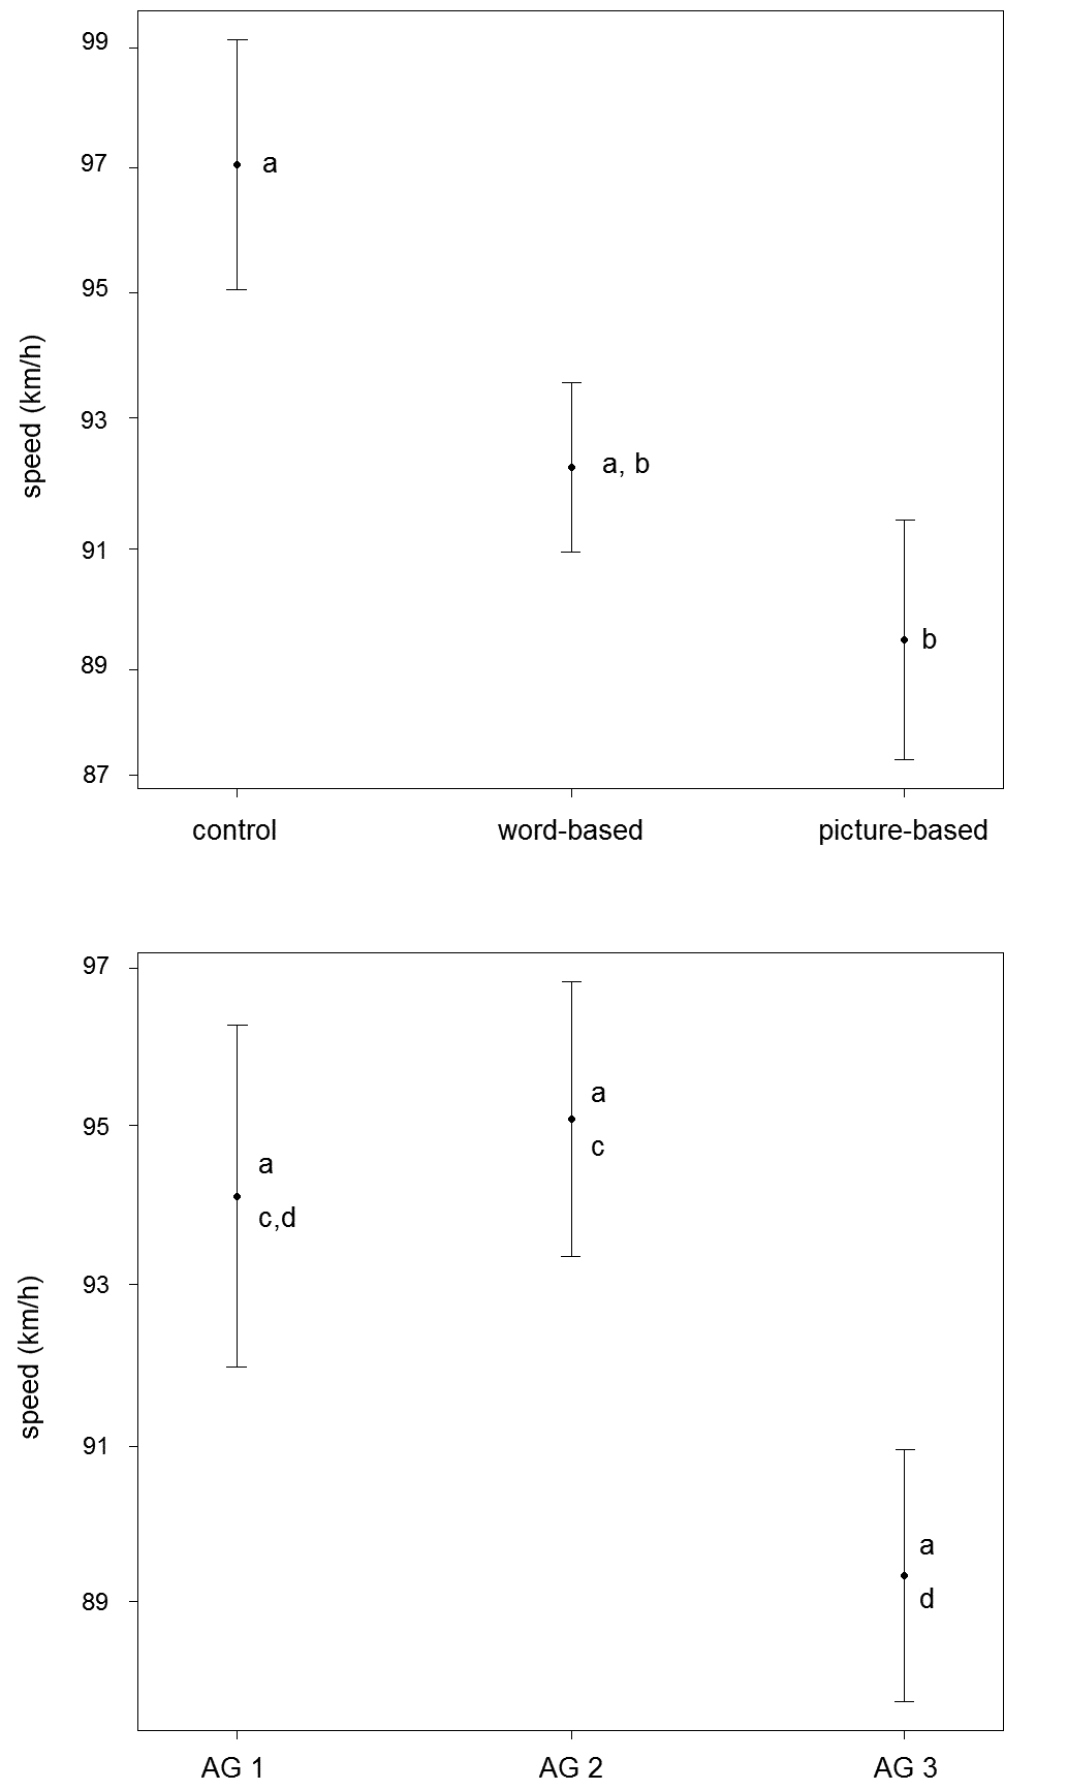
Participant speed at twilight by treatment and age group. Means and standard errors of speeds (mph) of participants at twilight in: Top- the three treatments; Bottom- the three age groups. Significantly different treatments have different letters next to them (a’s and b’s indicate significant differences at α= 0.05; c’s and d’s indicate significant differences at α= 0.10). n=30 for word- and picture-based treatments; n= 29 in control because we removed an outlier (>3 standard deviations from the grand mean). |