|
||
|
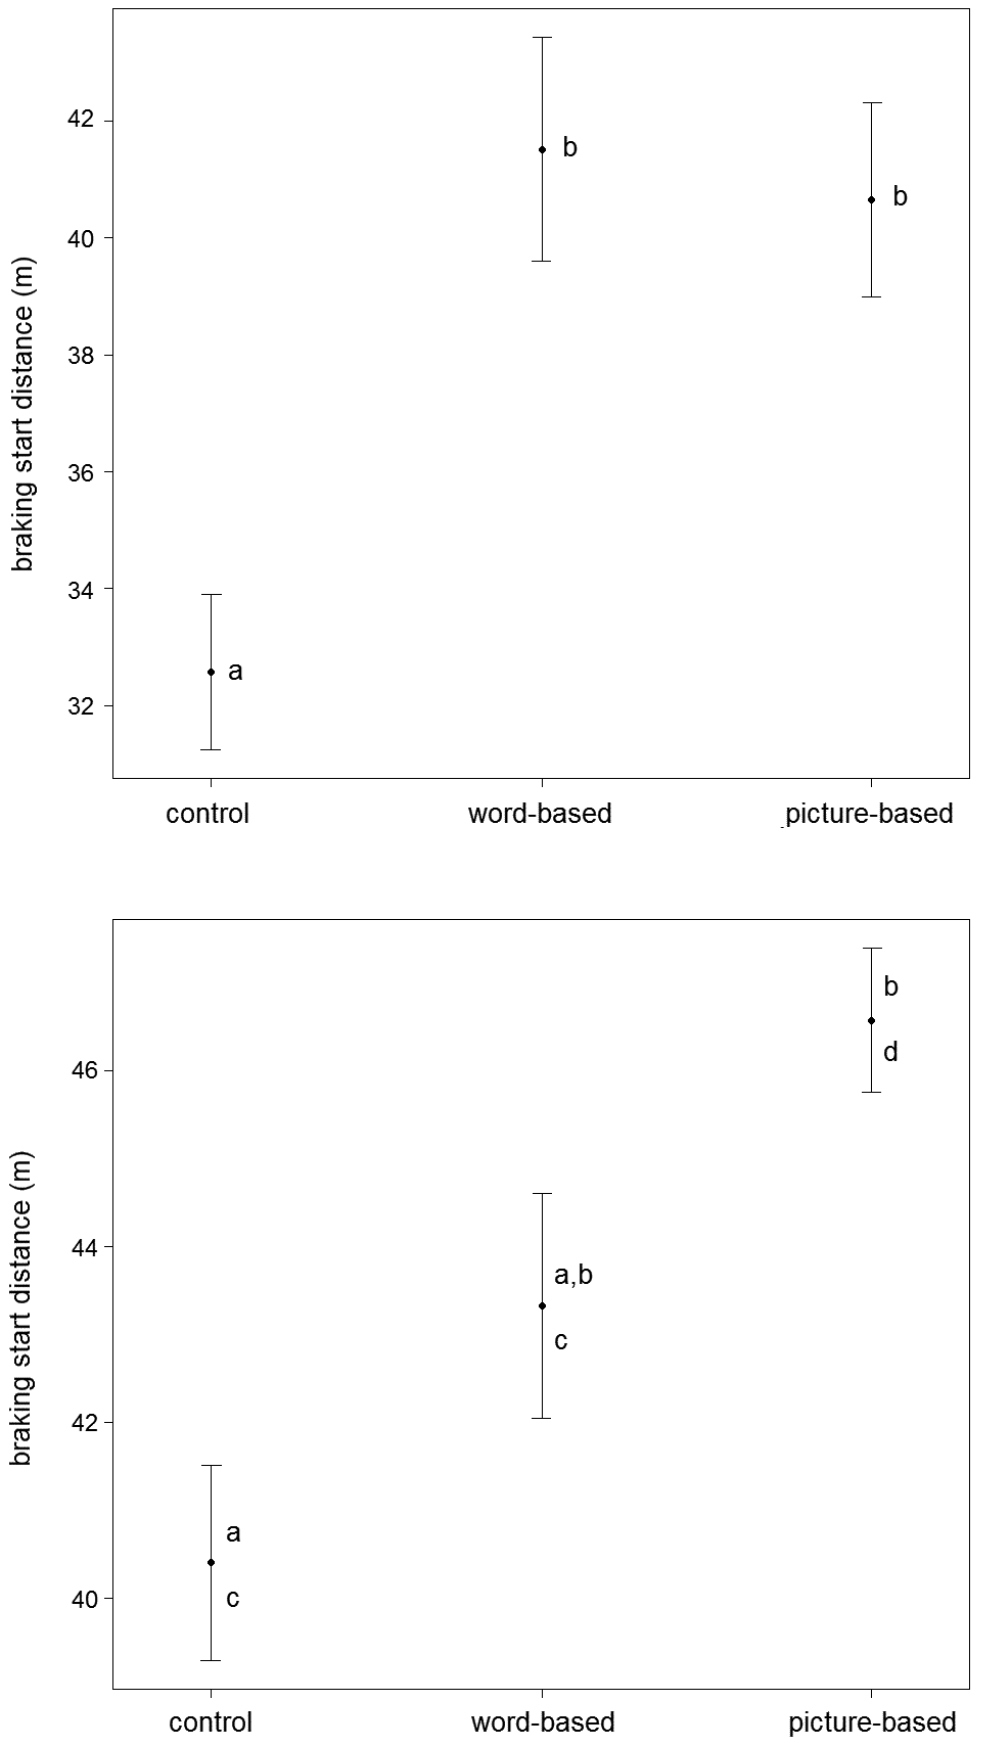
Braking distances by treatment. Means and standard errors of braking distances (m). Significantly different treatments have different letters next to them (a’s and b’s indicate significant differences at α = 0.05; c’s and d’s indicate significant differences at α= 0.10). Top- the three treatments at twilight. Control n = 26, word- and picture-based n = 29 because we removed outliers (>3 standard deviations from the grand mean); Bottom- in the three treatments at night. Control n = 27, word- and picture-based n = 30. Nighttime data were transformed using the Box-Cox transformation, but values in this figure are untransformed. |