|
||
|
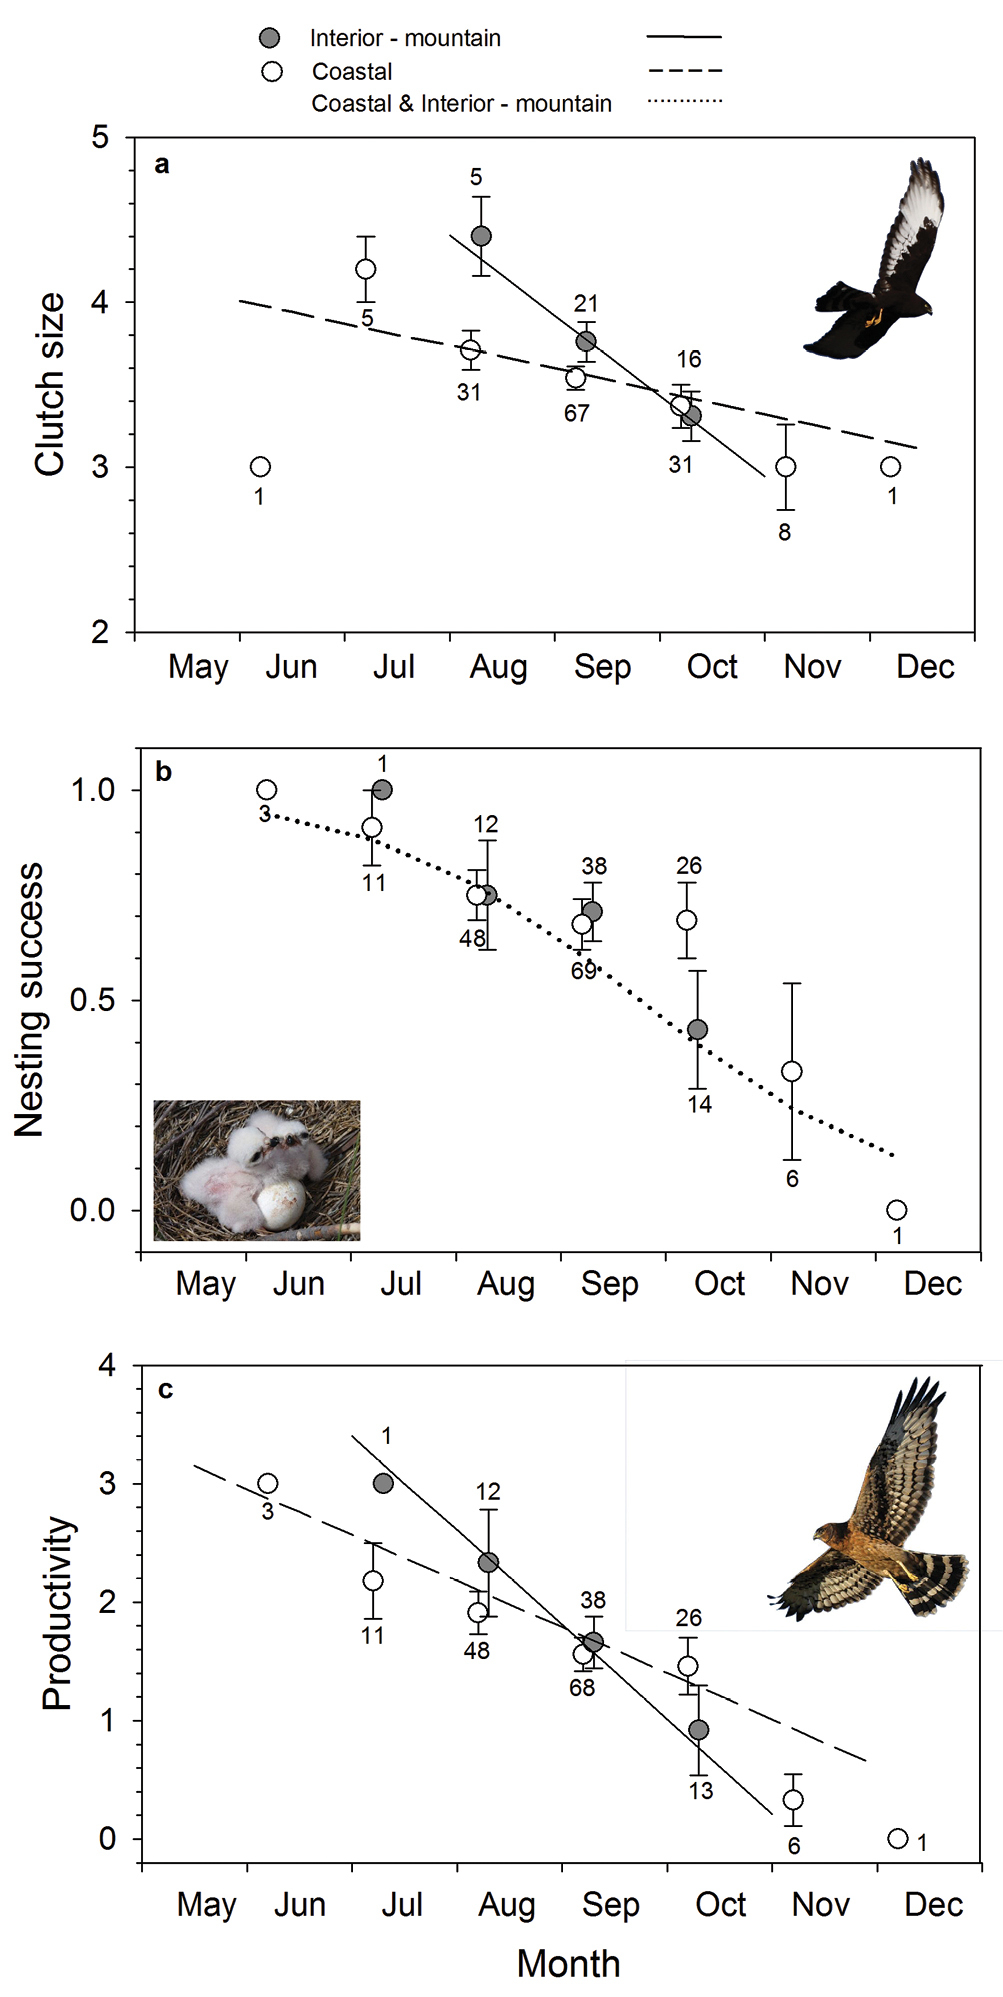
Black Harrier breeding performance (a clutch size b nesting success c productivity) variation according to lay date and region (coastal nests: white circles/dashed line; interior-mountain nests: grey dark circles/ solid line). Lines represent modelled data from the GLMM results (Table 3). Raw data (circles) are also shown for illustration purposes and have been averaged over two consecutive 15-days periods. Sample sizes (number of nests) are indicated above the error bars. The point line represents the breeding success variation with laying date for both coastal and interior-mountain regions (this relationship did not differ between regions). |