|
||
|
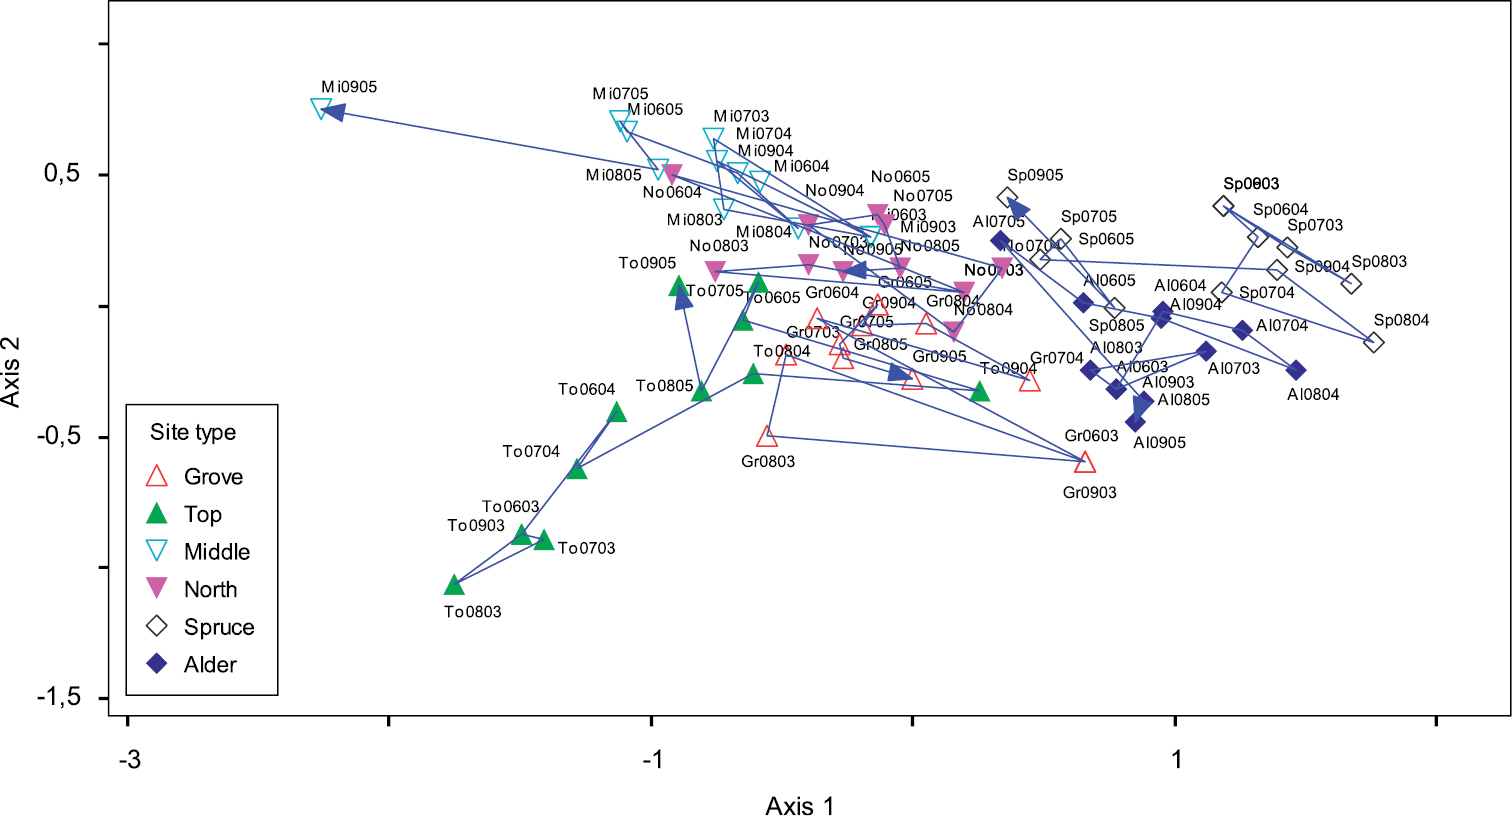
The NMDS plot showing temporal change in enzyme activity per SOM. Successional vectors joining the monthly means of replicate samples of each study site (i.e. experimental treatment) taken in June, July, August and September in 2003, 2004 and 2005. Point labels show two initials of the site, sampling month and year (e.g. Gr0603 = Grove June 2003). |