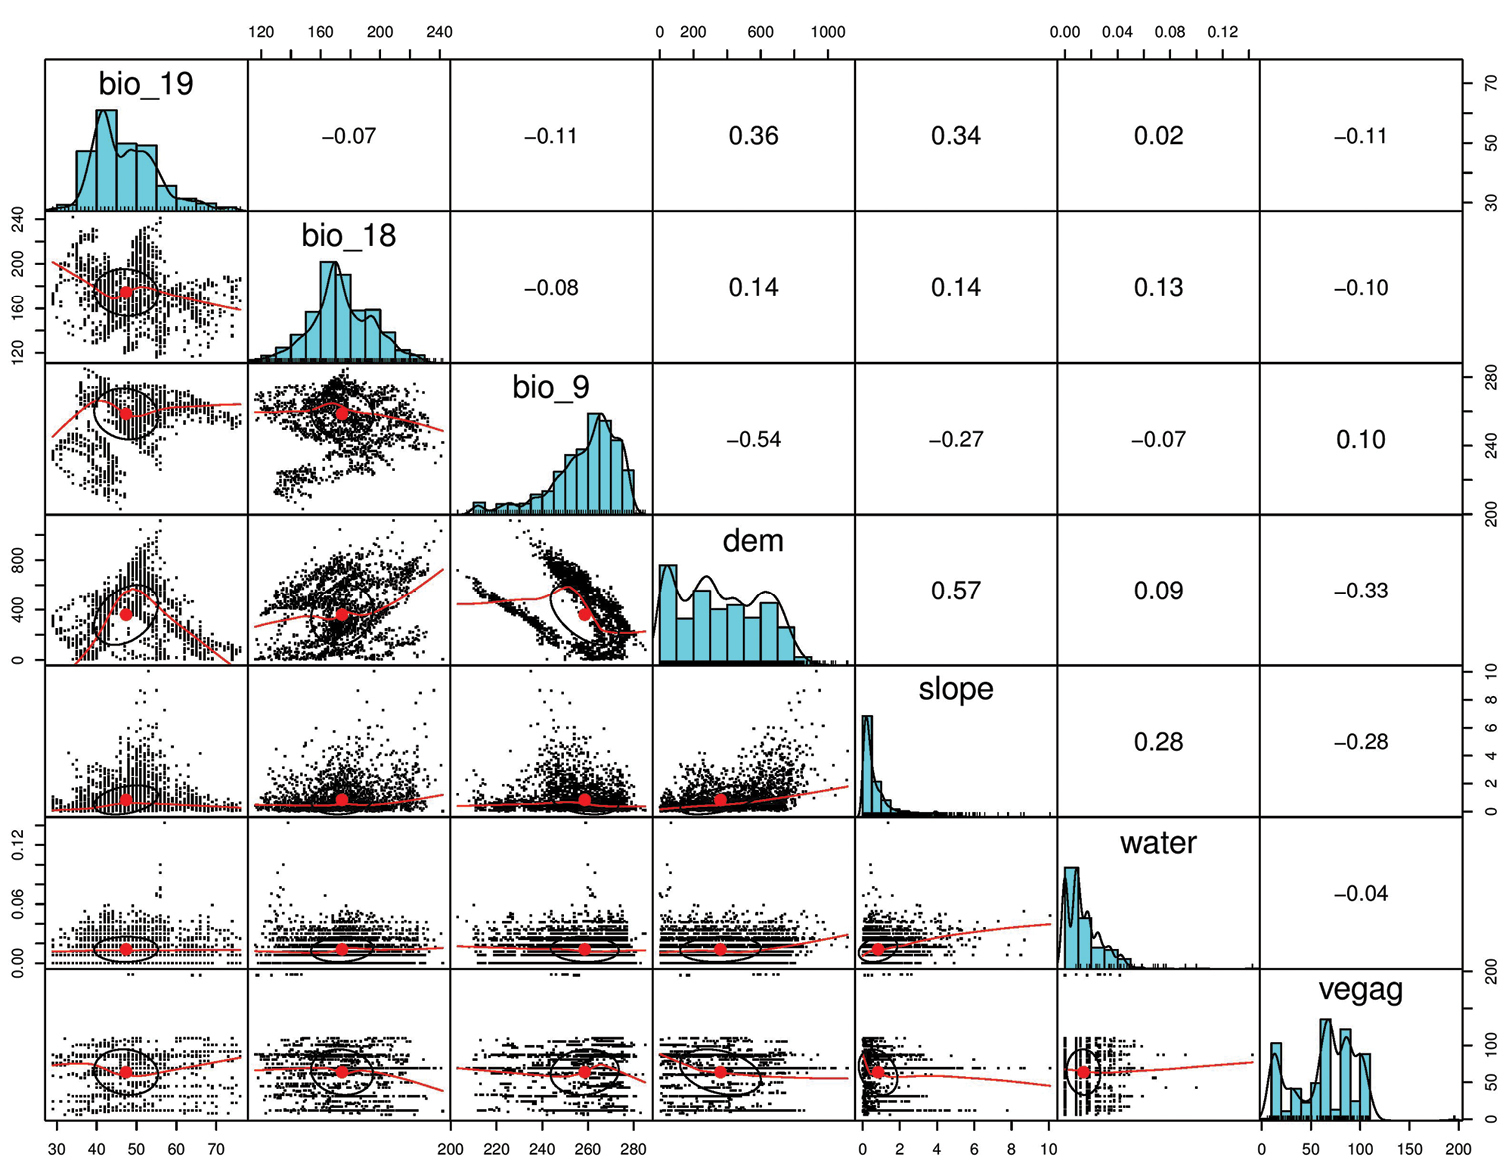
Pairs analysis of predictive variables against northern quoll presences. Diagonal=variable name and histogram, left of diagonal= scatter plots and trend lines and right of diagonal gives Spearman rank correlation coeffient. Axis figure represent point values corresponding variables.


  Part of: Molloy SW, Davis RA, Dunlop JA, van Etten EJB (2017) Applying surrogate species presences to correct sample bias in species distribution models: a case study using the Pilbara population of the Northern Quoll. Nature Conservation 18: 27-46. https://doi.org/10.3897/natureconservation.18.12235