|
||
|
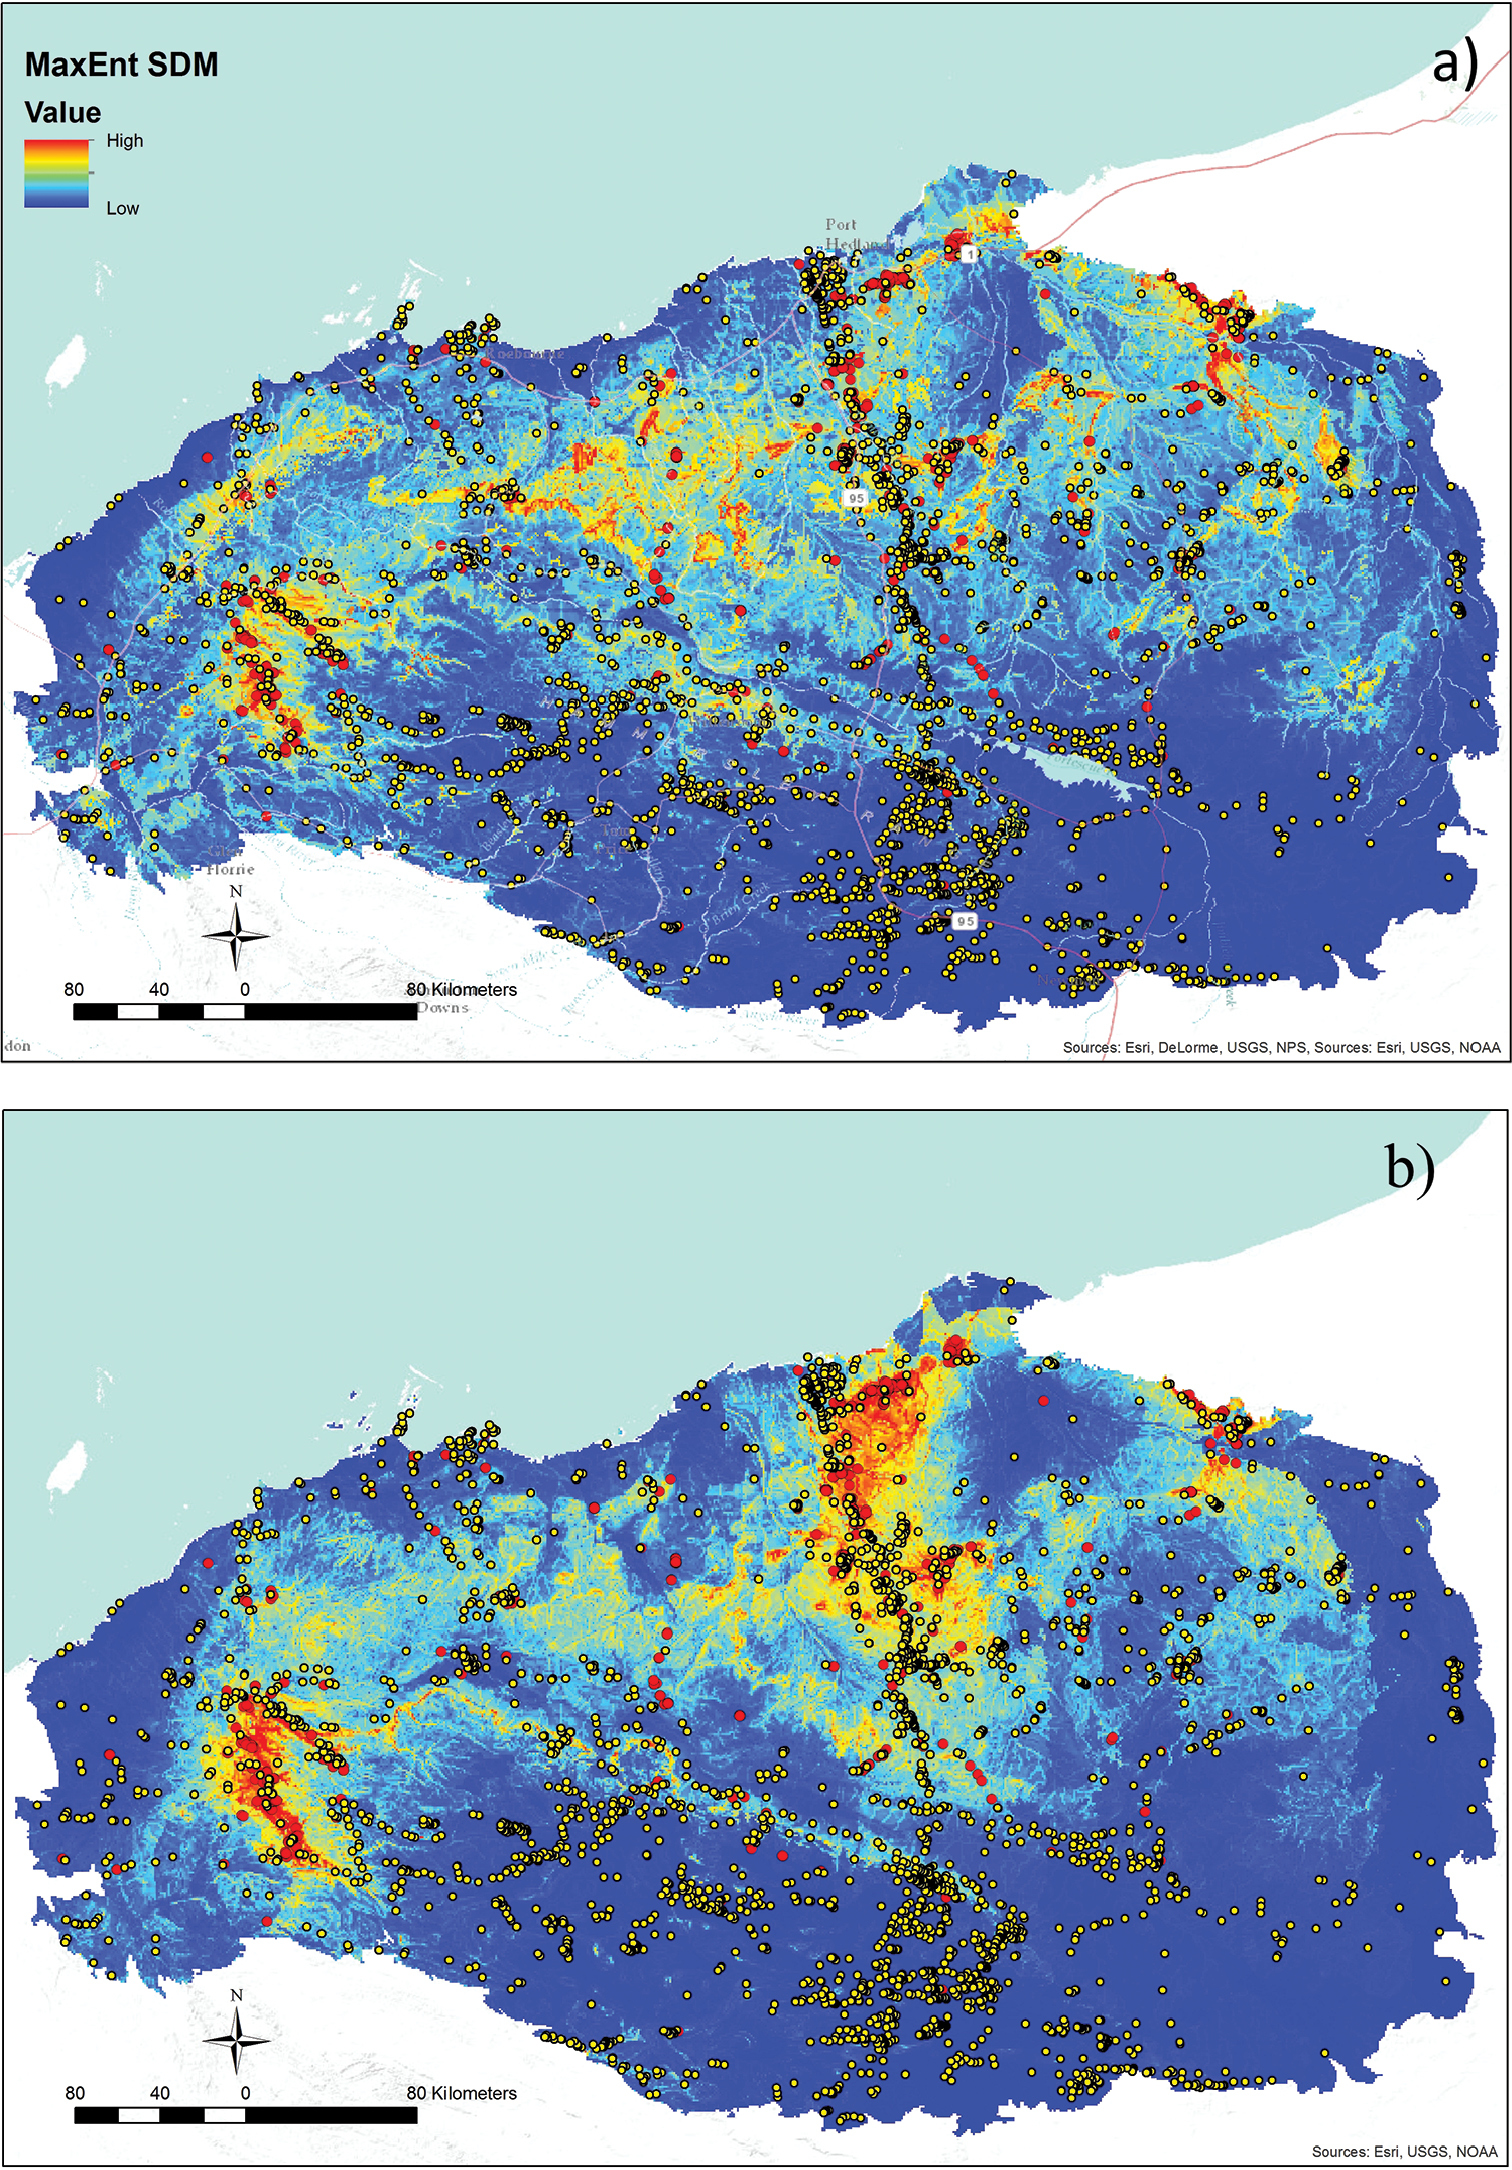
a MaxEnt SDM constructed with Bias Grid (Figure 3) and the final variable suite (Table 1) b MaxEnt SDM constructed without bias grid. Red dots indicate northern quoll presences and yellow, surrogate presences. |
|
||||||||
| Part of: Molloy SW, Davis RA, Dunlop JA, van Etten EJB (2017) Applying surrogate species presences to correct sample bias in species distribution models: a case study using the Pilbara population of the Northern Quoll. Nature Conservation 18: 27-46. https://doi.org/10.3897/natureconservation.18.12235 |