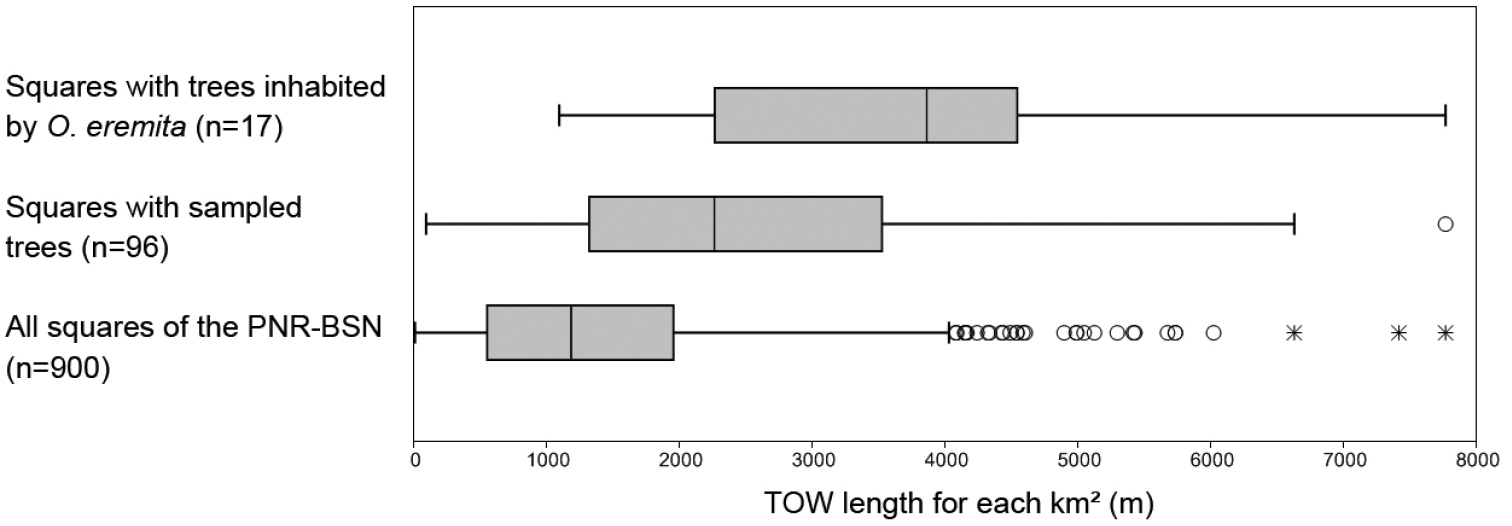
Frequencies of 1kmĀ² squares according to the TOW length. Three sample groups are presented: PNR-BSN (n = 900 squares); Sampled trees (n = 96 squares); Trees inhabited by O. eremita (n = 17 squares). All differences between groups are significant at the threshold of 0.001% (ANOVA).


  Part of: Dodelin B, Gaudet S, Fantino G (2017) Spatial analysis of the habitat and distribution of Osmoderma eremita (Scop.) in trees outside of woodlands. In: Campanaro A, Hardersen S, Sabbatini Peverieri G, Carpaneto GM (Eds) Monitoring of saproxylic beetles and other insects protected in the European Union. Nature Conservation 19: 149-170. https://doi.org/10.3897/natureconservation.19.12417