|
||
|
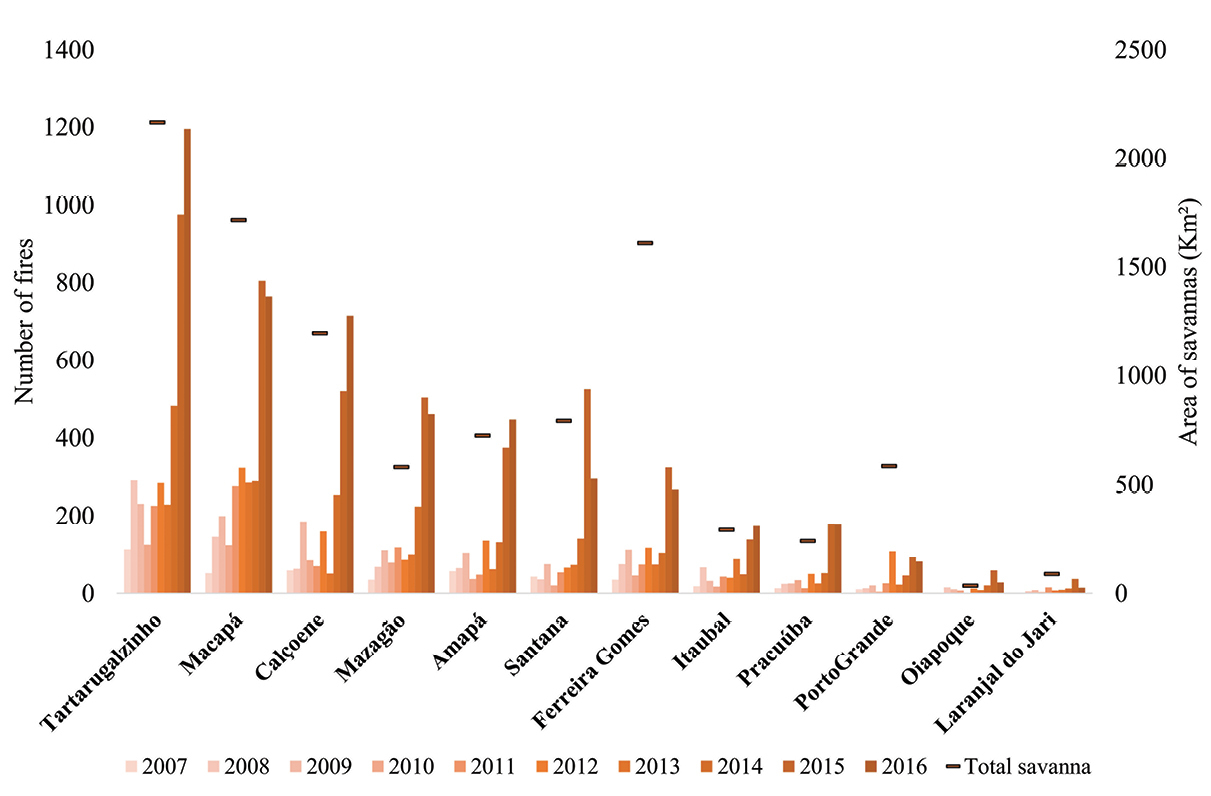
Fire in the Cerrado of Amapá, 2007 – 2016. Total number of hot pixels between 2007 and 2016, and total area of savanna habitats per municipality, in order of total number of outbreaks between 2007 and 2016. The hot pixels were quantified from shapefiles of the occurrence of burns obtained from the databases of the Instituto Nacional de Pesquisas Espaciais (INPE) (https://prodwww-queimadas.dgi.inpe.br/bdqueimadas/). Based on these shapefiles, and using ArcGIS v10.4.1 (ESRI 2011) the total number of hot pixels per year and per month within the Cerrado of Amapá were quantified in accordance with the Brazilian Institute of Geography and Statistics vegetation cover map for the Amazon (IBGE 2004a) and overlaid with the municipality boundaries available from the Amapá State Environmental Secretariat (SEMA-AP 2016). The area of savanna habitats was quantified as described in the legend of Figure 1. |