|
||
|
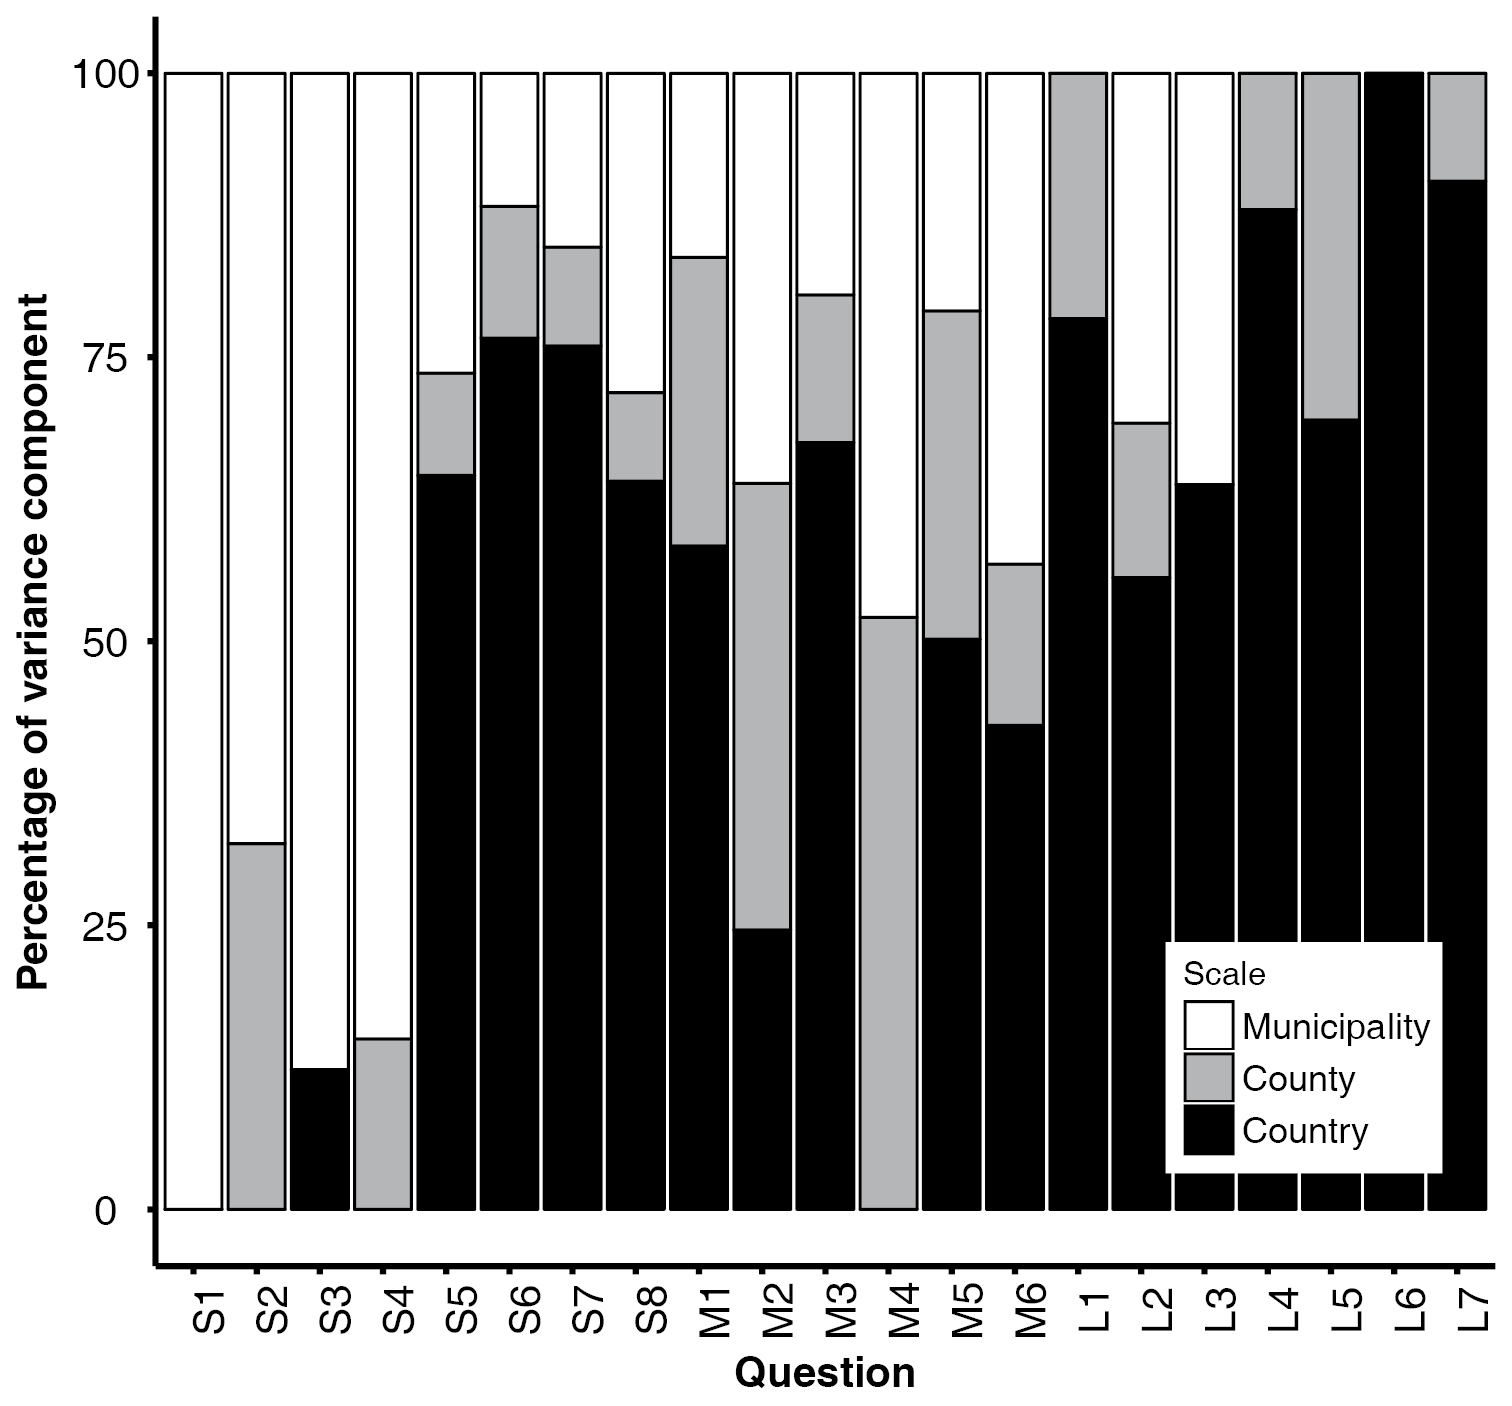
The percentage of the variance components explained by municipality (white), county (grey) and country (black) for each of the questions and statements in Table 2. |
|
||||||||
| Part of: Andreassen HP, Gangaas KE, Kaltenborn BP (2018) Matching social-ecological systems by understanding the spatial scale of environmental attitudes. Nature Conservation 30: 69-81. https://doi.org/10.3897/natureconservation.30.28289 |