|
||
|
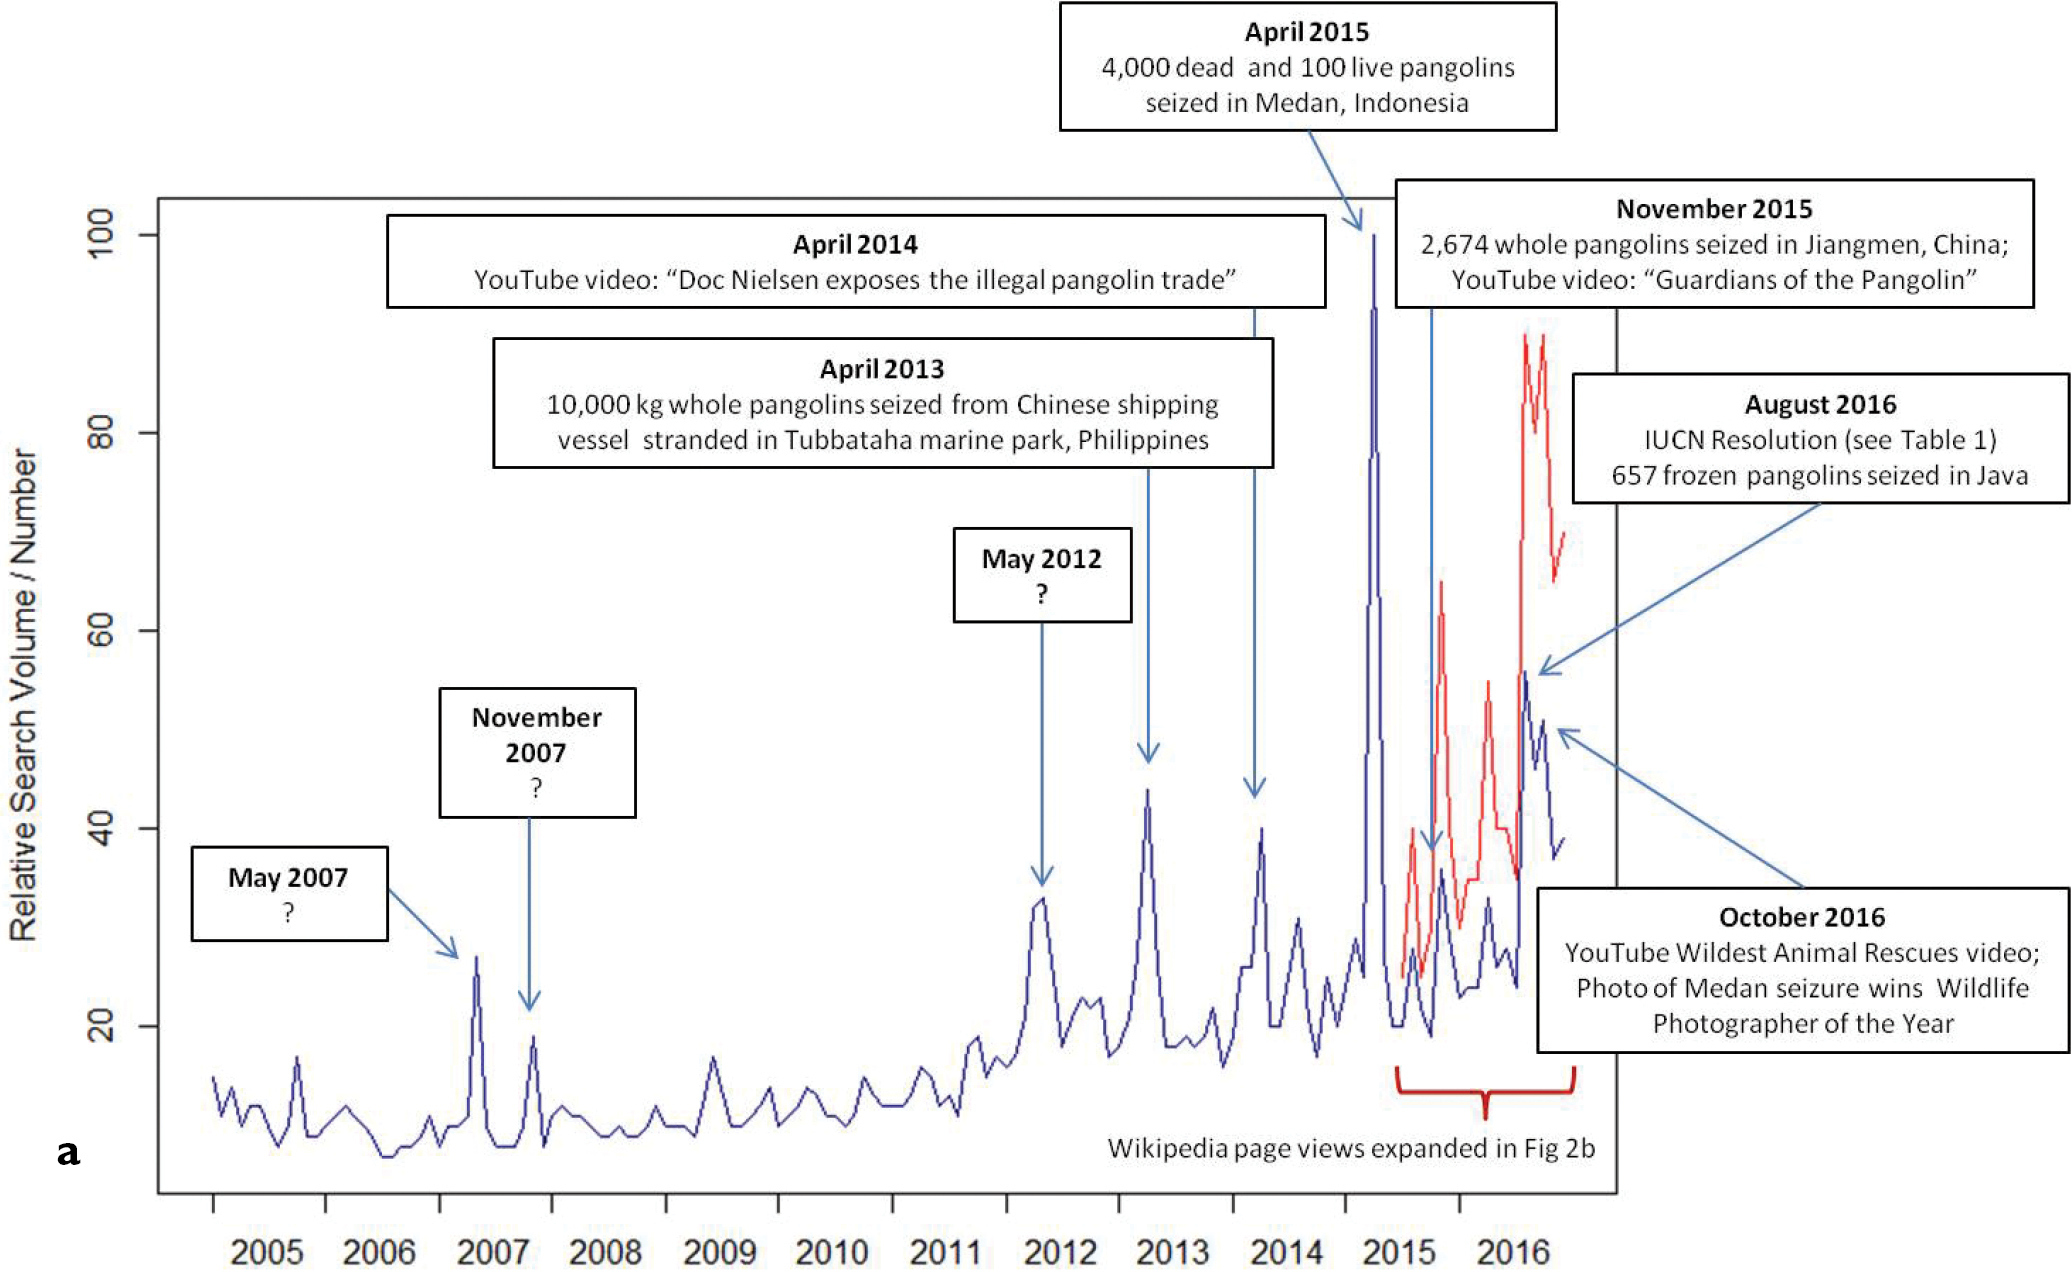
Monthly Google Trends (GT) search volume (blue) shown against number of Wikipedia page views (red), 2005–2016. Note that GT shows relative search volume, where 100 represents the peak and all other values are relative to the peak; two breakpoints in the data were identified (at February 2012 and March 2015). Text boxes show events that co-occurred with peaks in GT search volume (see Table 1 and text for details); peaks that did not appear to correspond with an event are marked with a ‘?’. GT peaks were identified as statistical outliers in time series data (see text) |