|
||
|
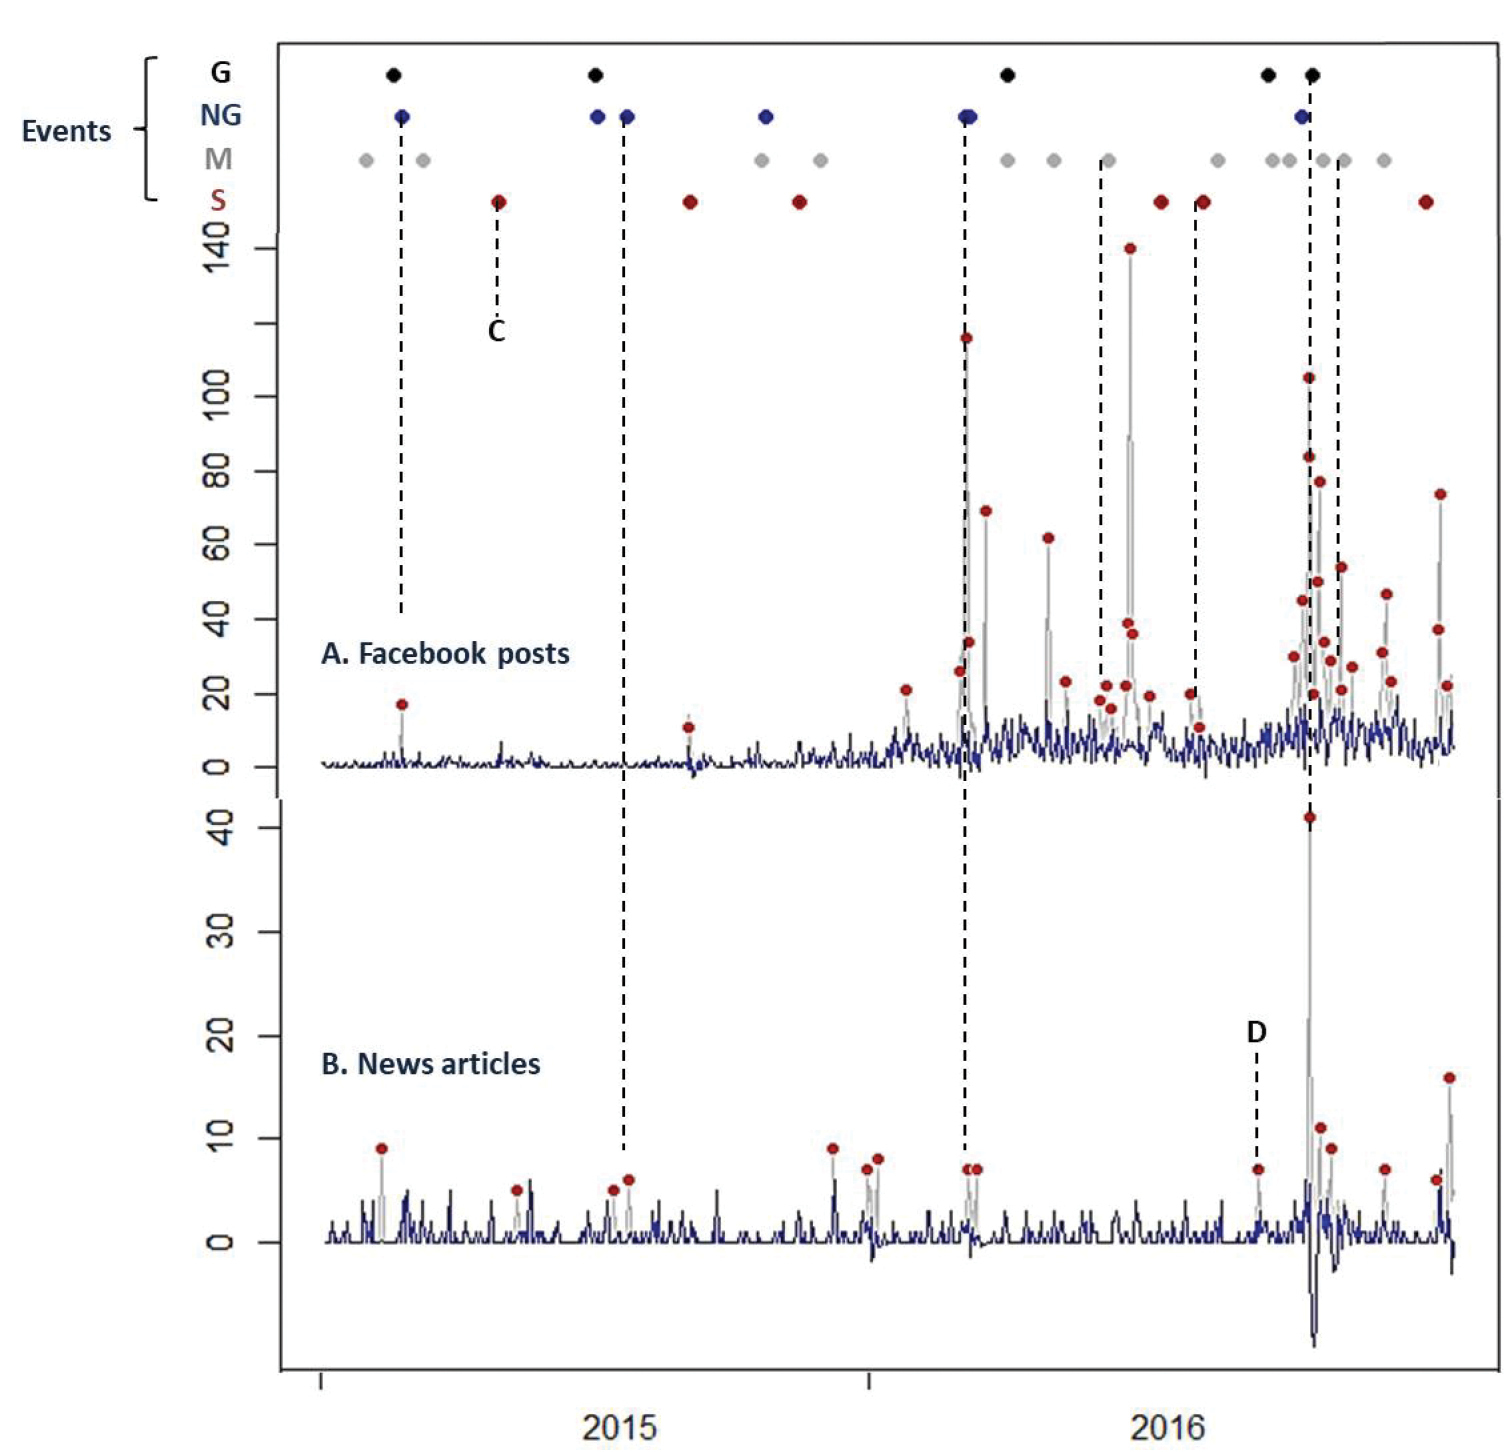
Daily trends in A the number of Faceook (FB) posts and B the number of news articles, showing peaks in activity (red circles) against the occurrence of events (top), 2015–2016. G=governmental event, NG=non-governmental event, M=media event or ‘other’, S=’major seizure’; for details of events see Table 1. Peaks in FB posts/news articles were identified as statistical outliers in time series data (see text; note that all positive outliers are shown in A but only 29 of these occurred on non-consecutive days and were thus counted as peaks in activity). C marks the Medan seizure associated with a peak in weekly GT (not shown); D marks the Javan seizure that was not identified as an event but corresponded with a peak in news articles (shown) and weekly GT (not shown) (both seizures are referred to in the text). |