|
||
|
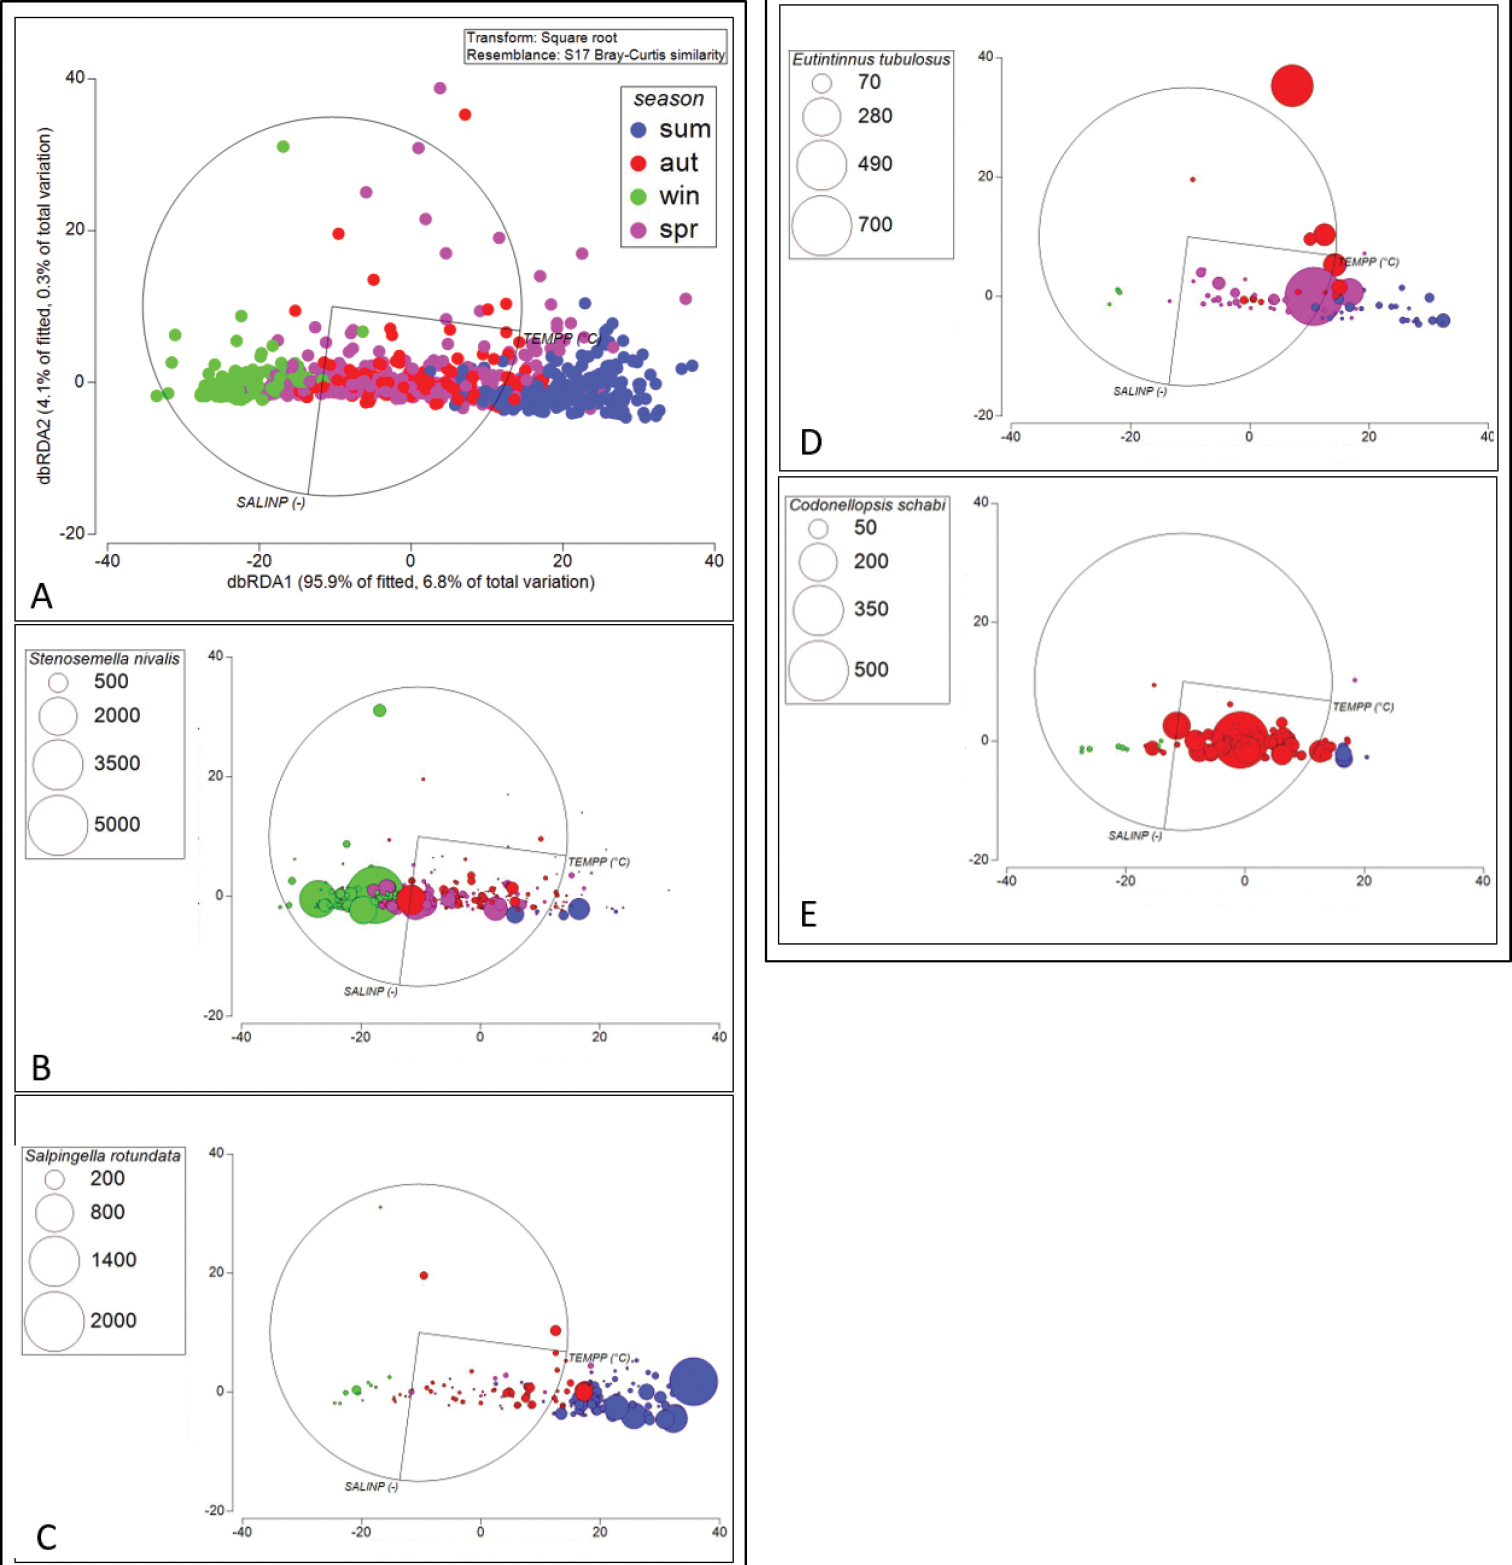
dbRDA (distance bases Redundancy Analysis) plot on the base of similarity in tintinnid composition constrained by temperature and salinity with axis significances (A). The colours represent samples collected in different seasons (blue=summer, red=autumn, green=winter, violet=spring). In the bubble plots (B–E), the bubble scale reports the relationship between bubble diameters and abundance measured for the most representative species: B Stenosemella nivalis C Salpingella rotundata D Eutintinnus tubulosus E Codonellopsis schabi. |