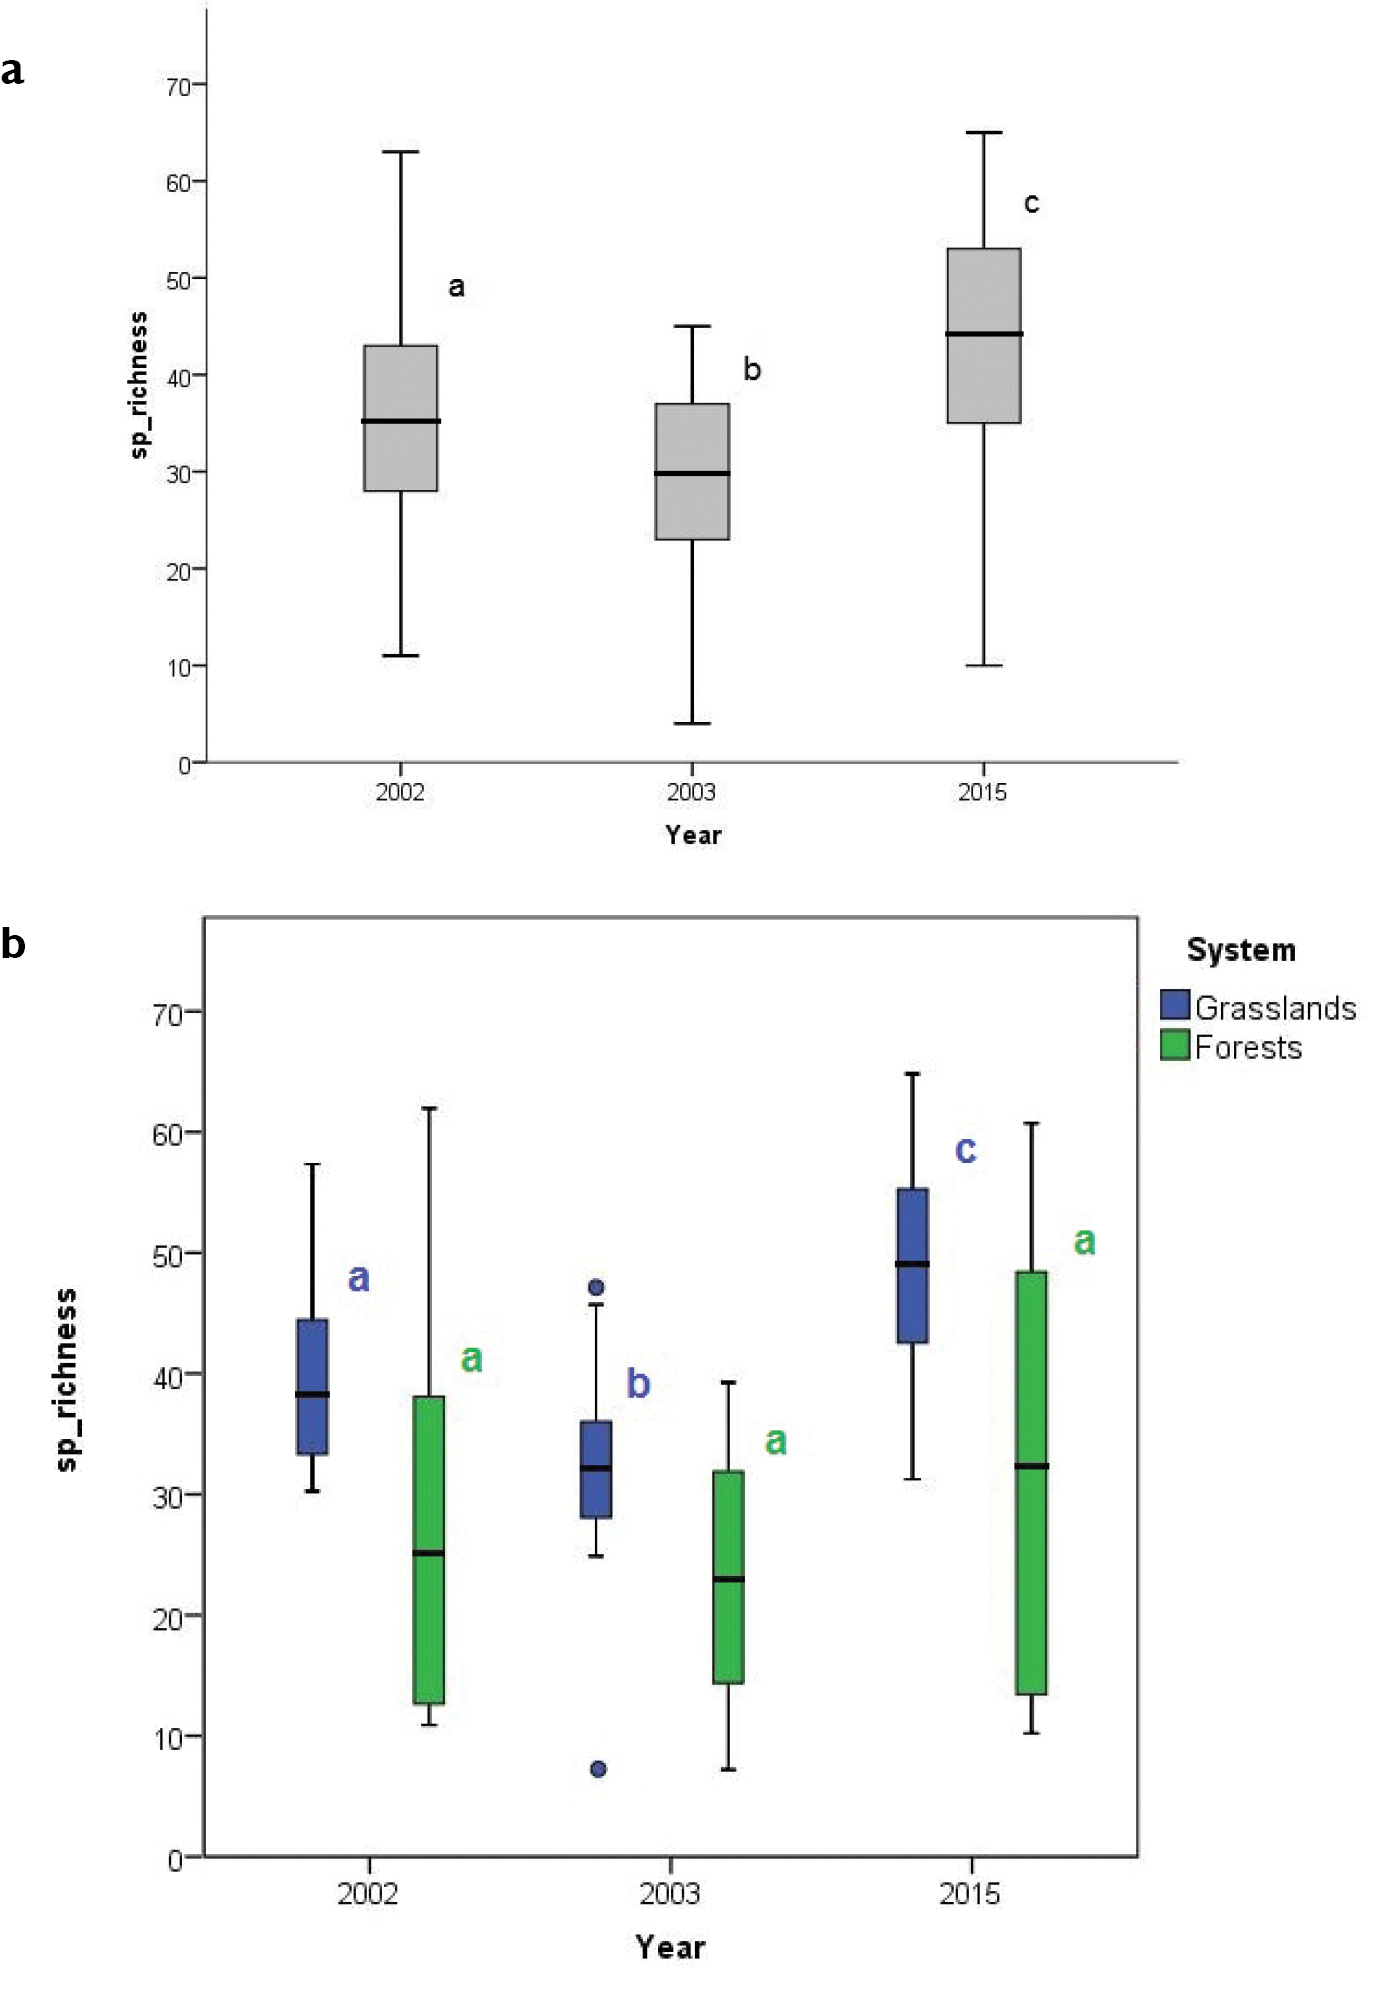
Mean values and variability of species richness per plot a for all the ecosystems, and b according to the two main ecosystems, i.e. grasslands (blue colour) and forests (green colour). Different letters indicate significant differences in mean values across time following post-hoc test results.


  Part of: Chelli S, Simonetti E, Campetella G, Chiarucci A, Cervellini M, Tardella FM, Tomasella M, Canullo R (2019) Plant diversity changes in a nature reserve: a probabilistic sampling method for quantitative assessments. In: Mazzocchi MG, Capotondi L, Freppaz M, Lugliè A, Campanaro A (Eds) Italian Long-Term Ecological Research for understanding ecosystem diversity and functioning. Case studies from aquatic, terrestrial and transitional domains. Nature Conservation 34: 145-161. https://doi.org/10.3897/natureconservation.34.30043