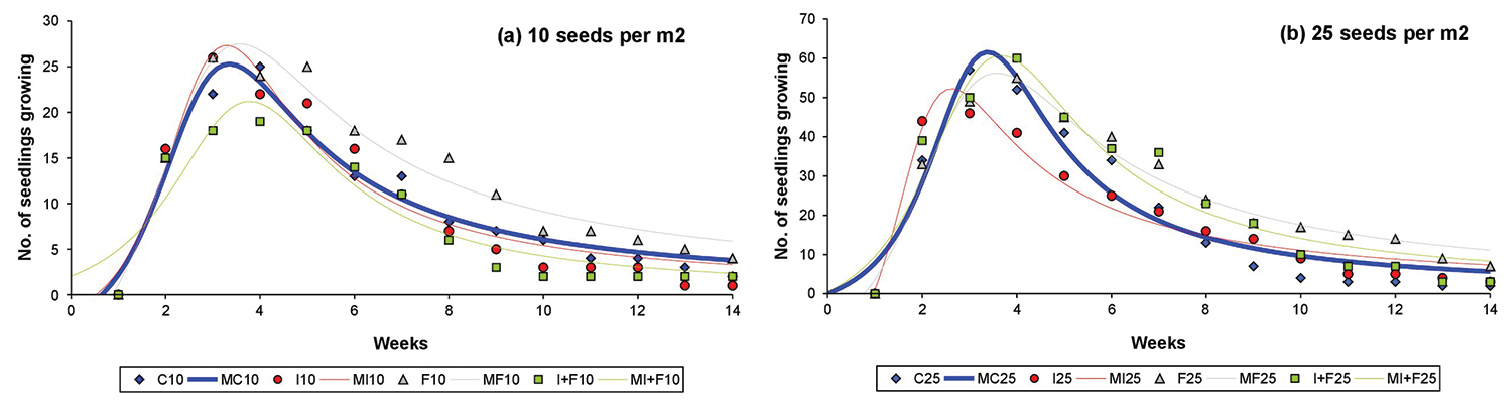
Number of seedlings growing plotted against time for each treatment (coded as in Fig. 1 and plotted with different colors) and seed densities of a 10 seeds per m2 and b 25 seeds per m2. Observations indicated by symbols, fitted rational models indicated by continuous lines (control identified by thick blue line).


  Part of: SolĂ© R, Gripenberg S, Lewis OT, Markesteijn L, Barrios H, Ratz T, Ctvrtecka R, Butterill PT, Segar ST, Metz MA, Dahl C, Rivera M, Viquez K, Ferguson W, Guevara M, Basset Y (2019) The role of herbivorous insects and pathogens in the regeneration dynamics of Guazuma ulmifolia in Panama. Nature Conservation 32: 81-101. https://doi.org/10.3897/natureconservation.32.30108