|
||
|
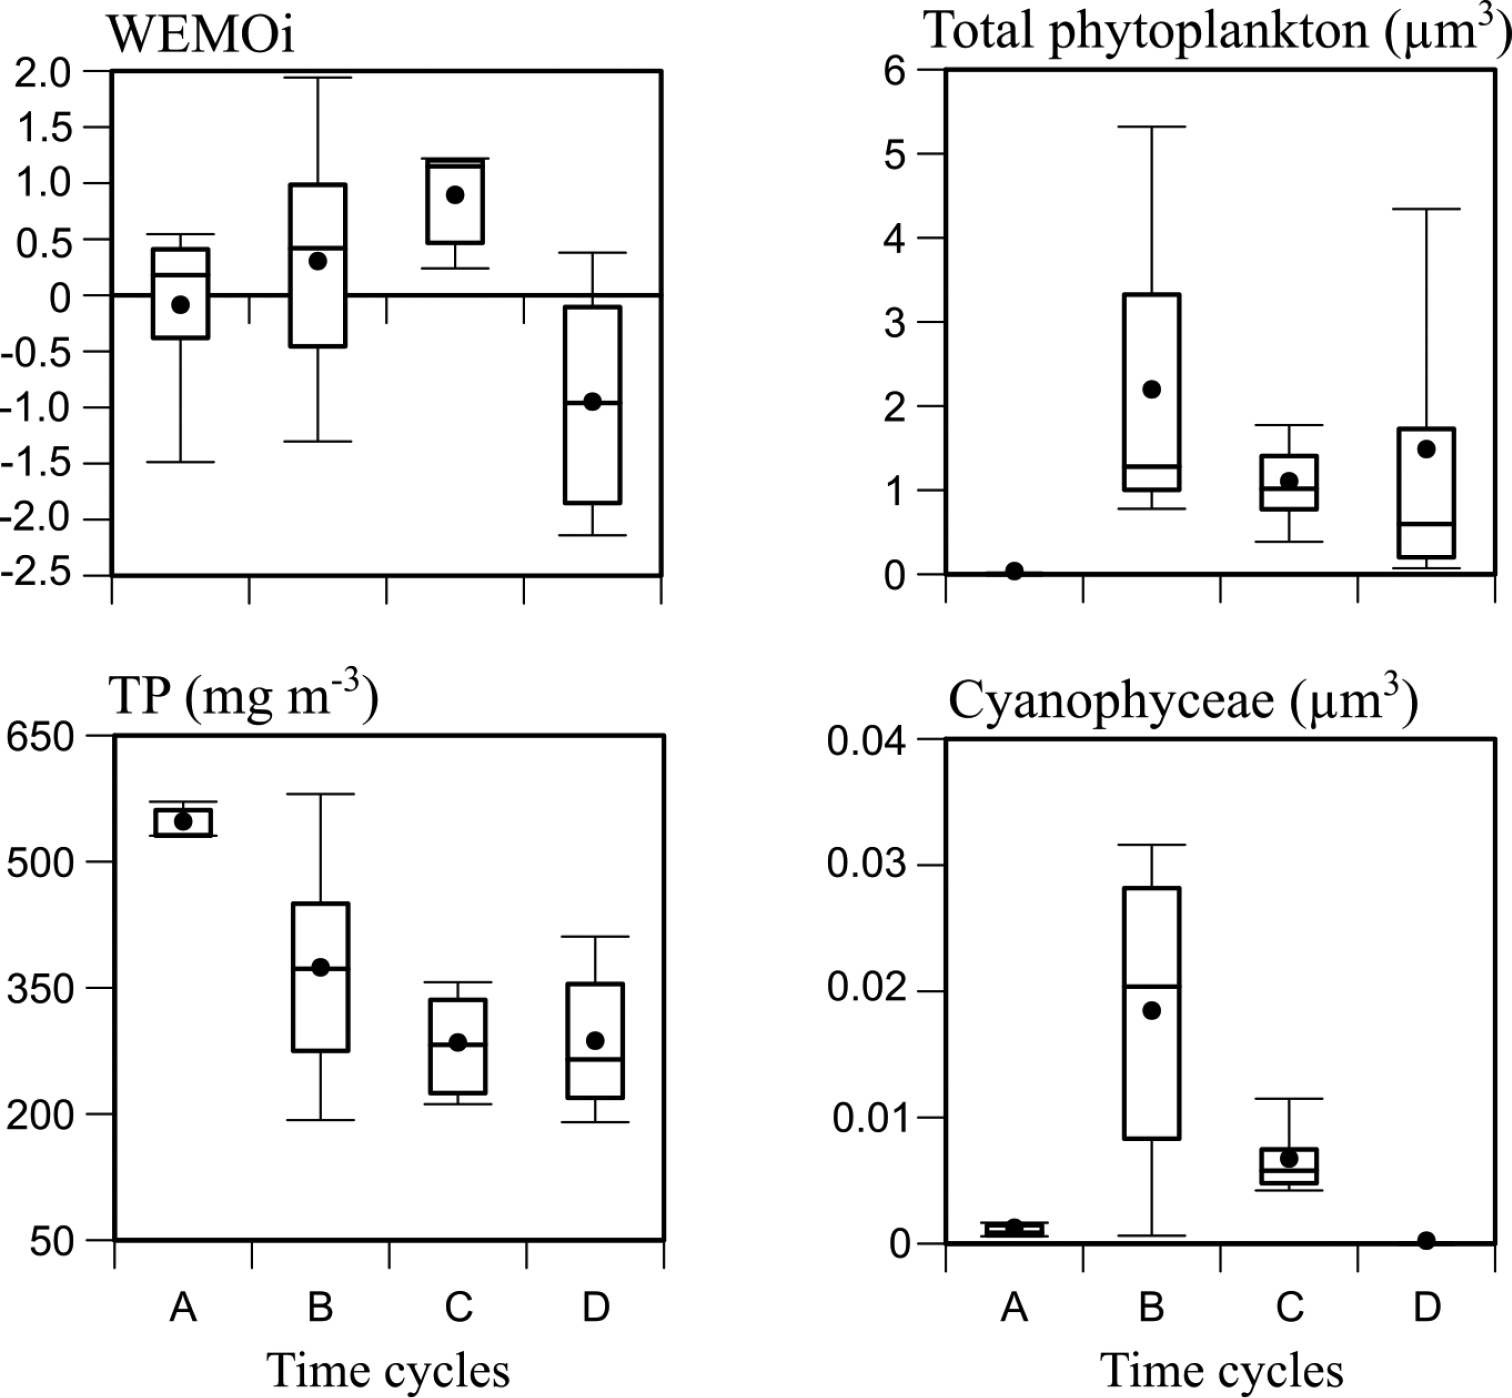
Variation of the Western Mediterranean Oscillation index (WEMOi), total phosphorous (TP), mean cell volume of the whole phytoplankton community (Total phytoplankton) and mean Cyanophyceae volume during the four time cycles of samplings (A = 1988–1989, B = 1994–1997, C = 2003, D = 2006–2015) in summer in Bidighinzu Lake. The lowest, second lowest, middle, second highest and highest lines in the box plots represent the 10th percentile, 25th percentile, median, 75th percentile and 90th percentile, respectively. Means are represented by black dots. |