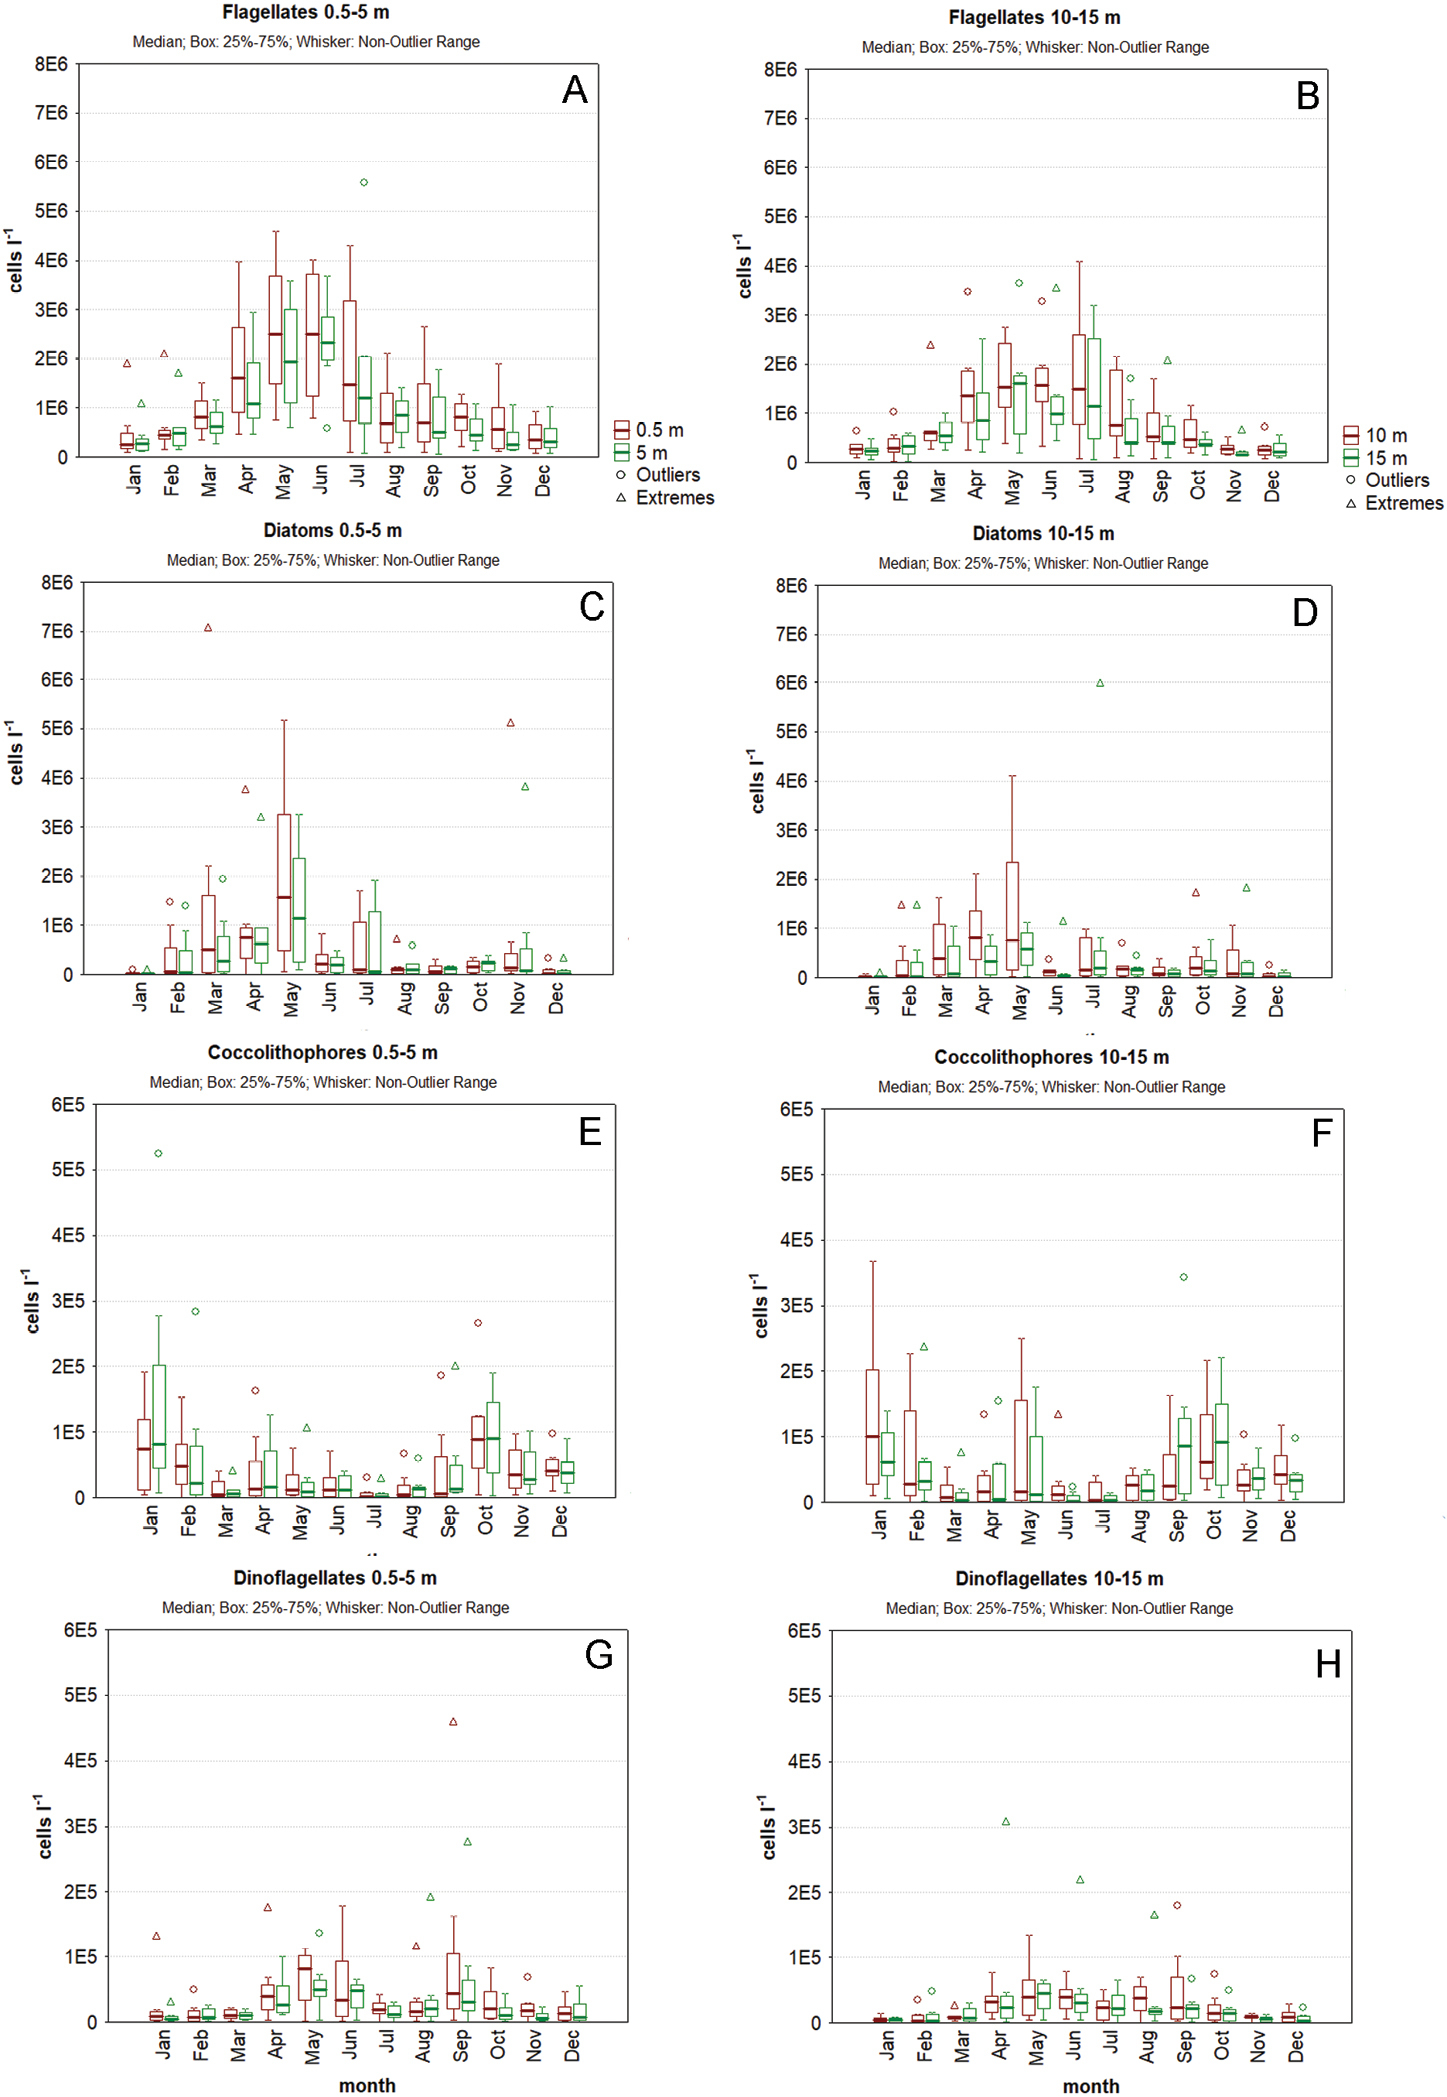
Seasonal cycle of flagellates (A–B), diatoms (C–D), coccolithophores (E–F) and dinoflagellates (G–H) at 0.5 and 5 m depth (A, C, E, G) and at 10 and 15 m depth (B, D, F, H). In the box plot, the bold line represents the median, the box the 25th and 75th percentiles of the distribution, the whisker the non-outlier range, the circle the outliers and the triangle the extremes. Note: y-scales are different for diatoms/flagellates and dinoflagellates/coccolithophores.


  Part of: Cerino F, Fornasaro D, Kralj M, Giani M, Cabrini M (2019) Phytoplankton temporal dynamics in the coastal waters of the north-eastern Adriatic Sea (Mediterranean Sea) from 2010 to 2017. In: Mazzocchi MG, Capotondi L, Freppaz M, Lugliè A, Campanaro A (Eds) Italian Long-Term Ecological Research for understanding ecosystem diversity and functioning. Case studies from aquatic, terrestrial and transitional domains. Nature Conservation 34: 343-372. https://doi.org/10.3897/natureconservation.34.30720