|
||
|
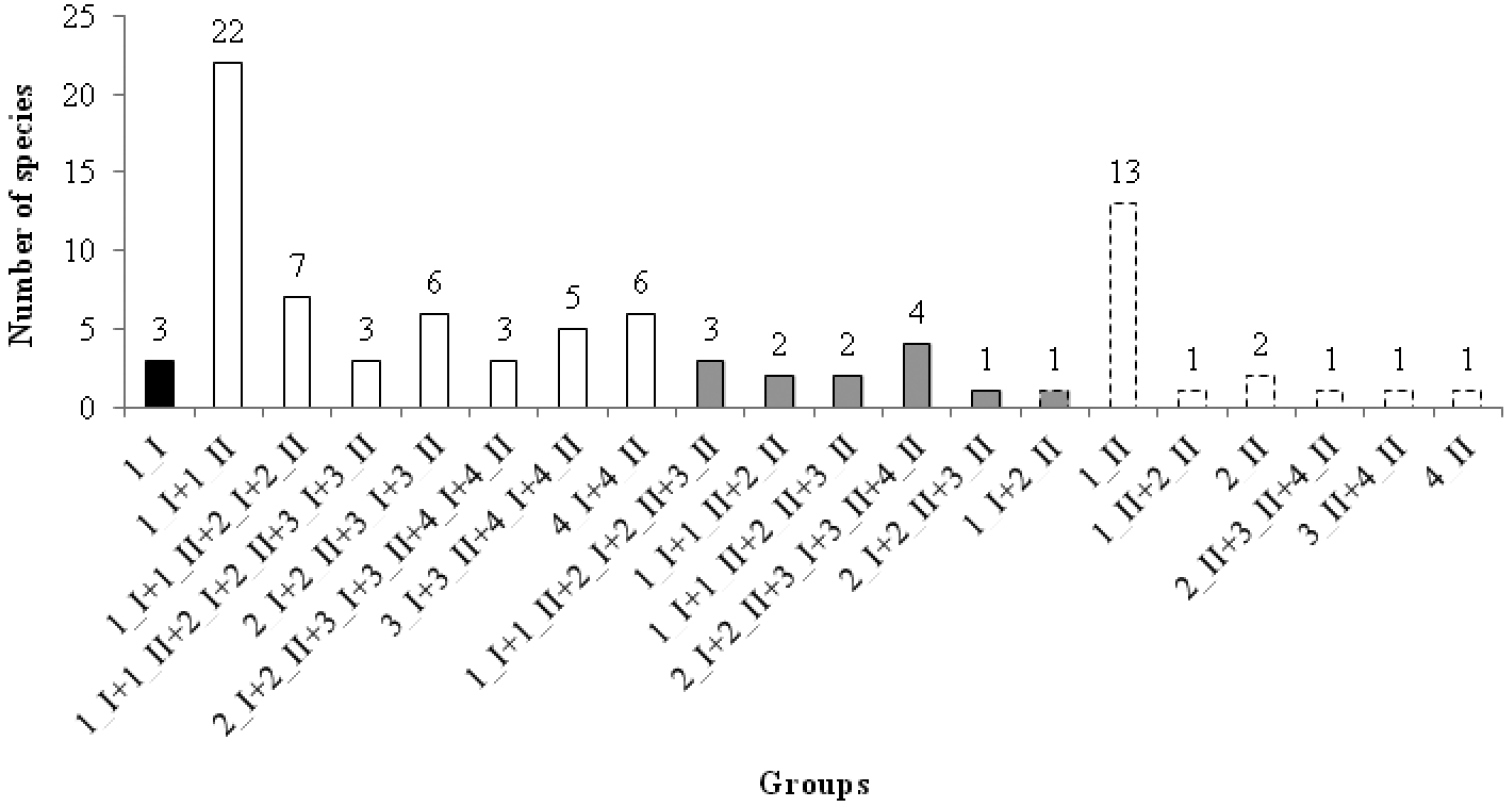
Changes along altitude. The number of significant IndVal species are shown for each combination of sampling periods (I = 1st sampling period, II = 2nd sampling period) and altitudinal bands (1, 550–1200 m; 2, 1250–1650 m; 3, 1700–2150 m; 4, 2200–2700 m). Different colours represent different statuses. Species that lost their indicator value with specific altitudinal bands during the second period (disappear; black, with continuous border); species stable over time (stable; white, with continuous border); species that showed, in the second sampling period, new significant associations for higher altitudinal bands, at the same time maintaining the association to the altitudinal bands of the first sampling period (altitudinal expansion; grey, with continuous border); species that lost their association to the lower altitudinal bands and gained new associations to higher ones during the second sampling period (altitudinal upward shift; grey with dotted border); species that became IndVal of specific altitudinal bands during the second sampling period (spread; white, with dotted border). |