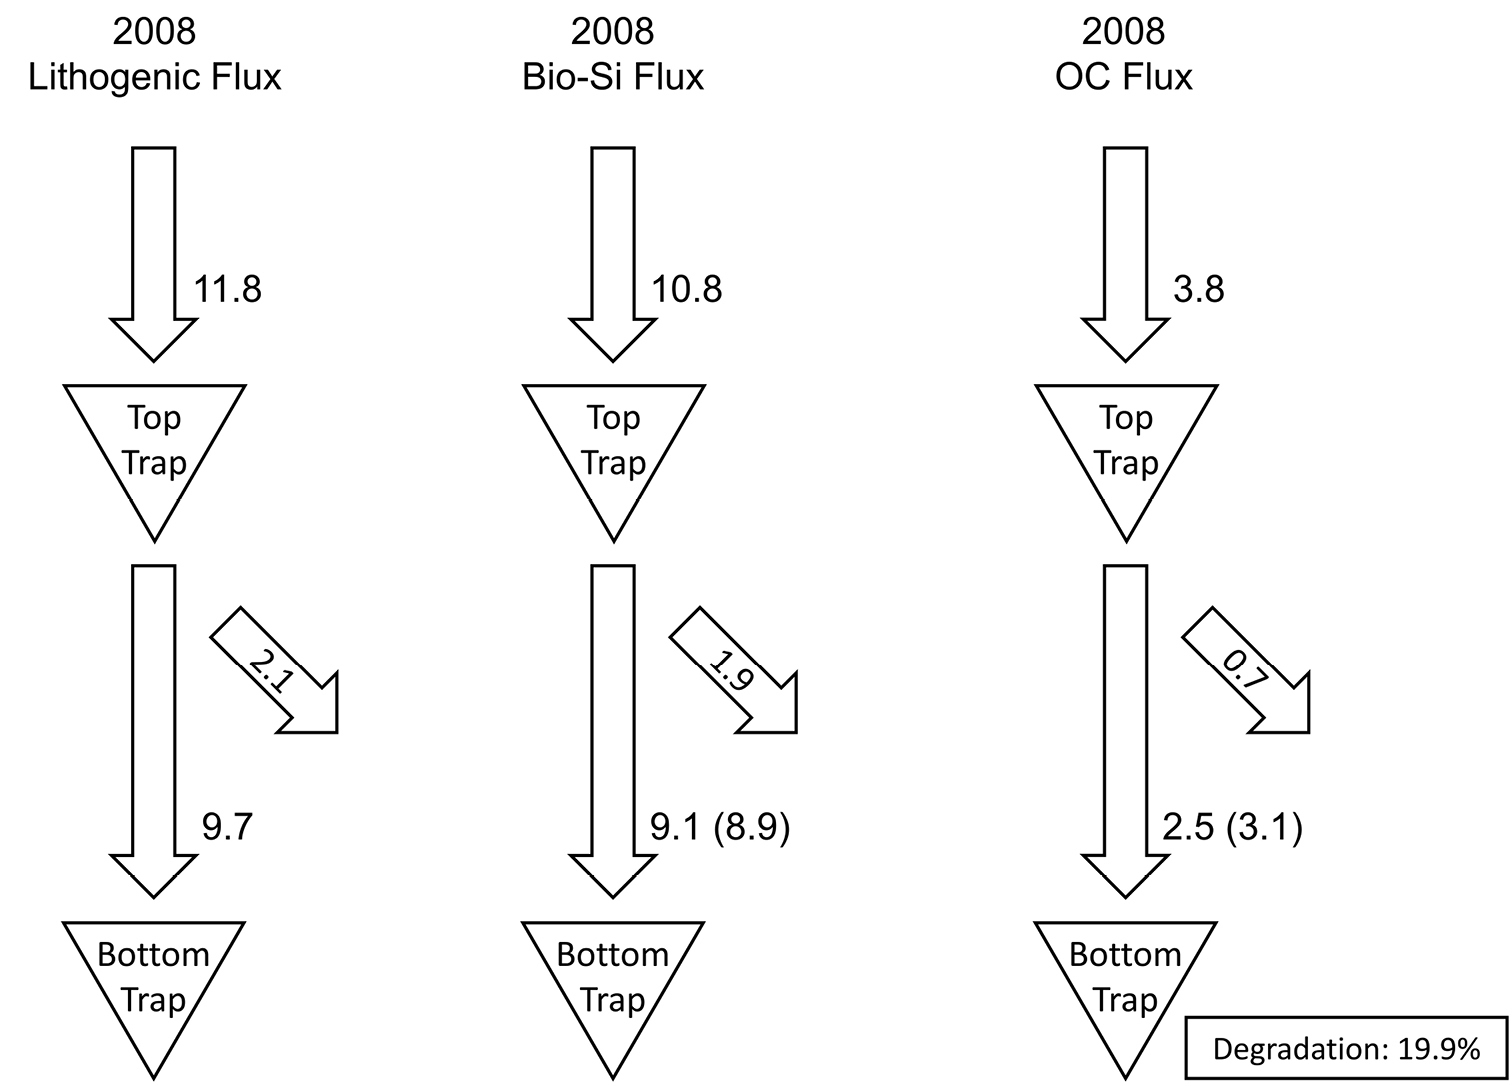
Mass balance and processes of lateral advection in 2008. The numbers near the vertical arrows represent lithogenic, biogenic silica and organic carbon annual integrated fluxes (g m-2 yr-1) at the top and bottom trap during 2008. The values near the sideways arrows represent the removed amount and numbers in brackets are the expected fluxes.


  Part of: Chiarini F, Ravaioli M, Capotondi L (2019) Interannual variability of vertical particle fluxes in the Ross Sea (Antarctica). In: Mazzocchi MG, Capotondi L, Freppaz M, Lugliè A, Campanaro A (Eds) Italian Long-Term Ecological Research for understanding ecosystem diversity and functioning. Case studies from aquatic, terrestrial and transitional domains. Nature Conservation 34: 417-440. https://doi.org/10.3897/natureconservation.34.30732