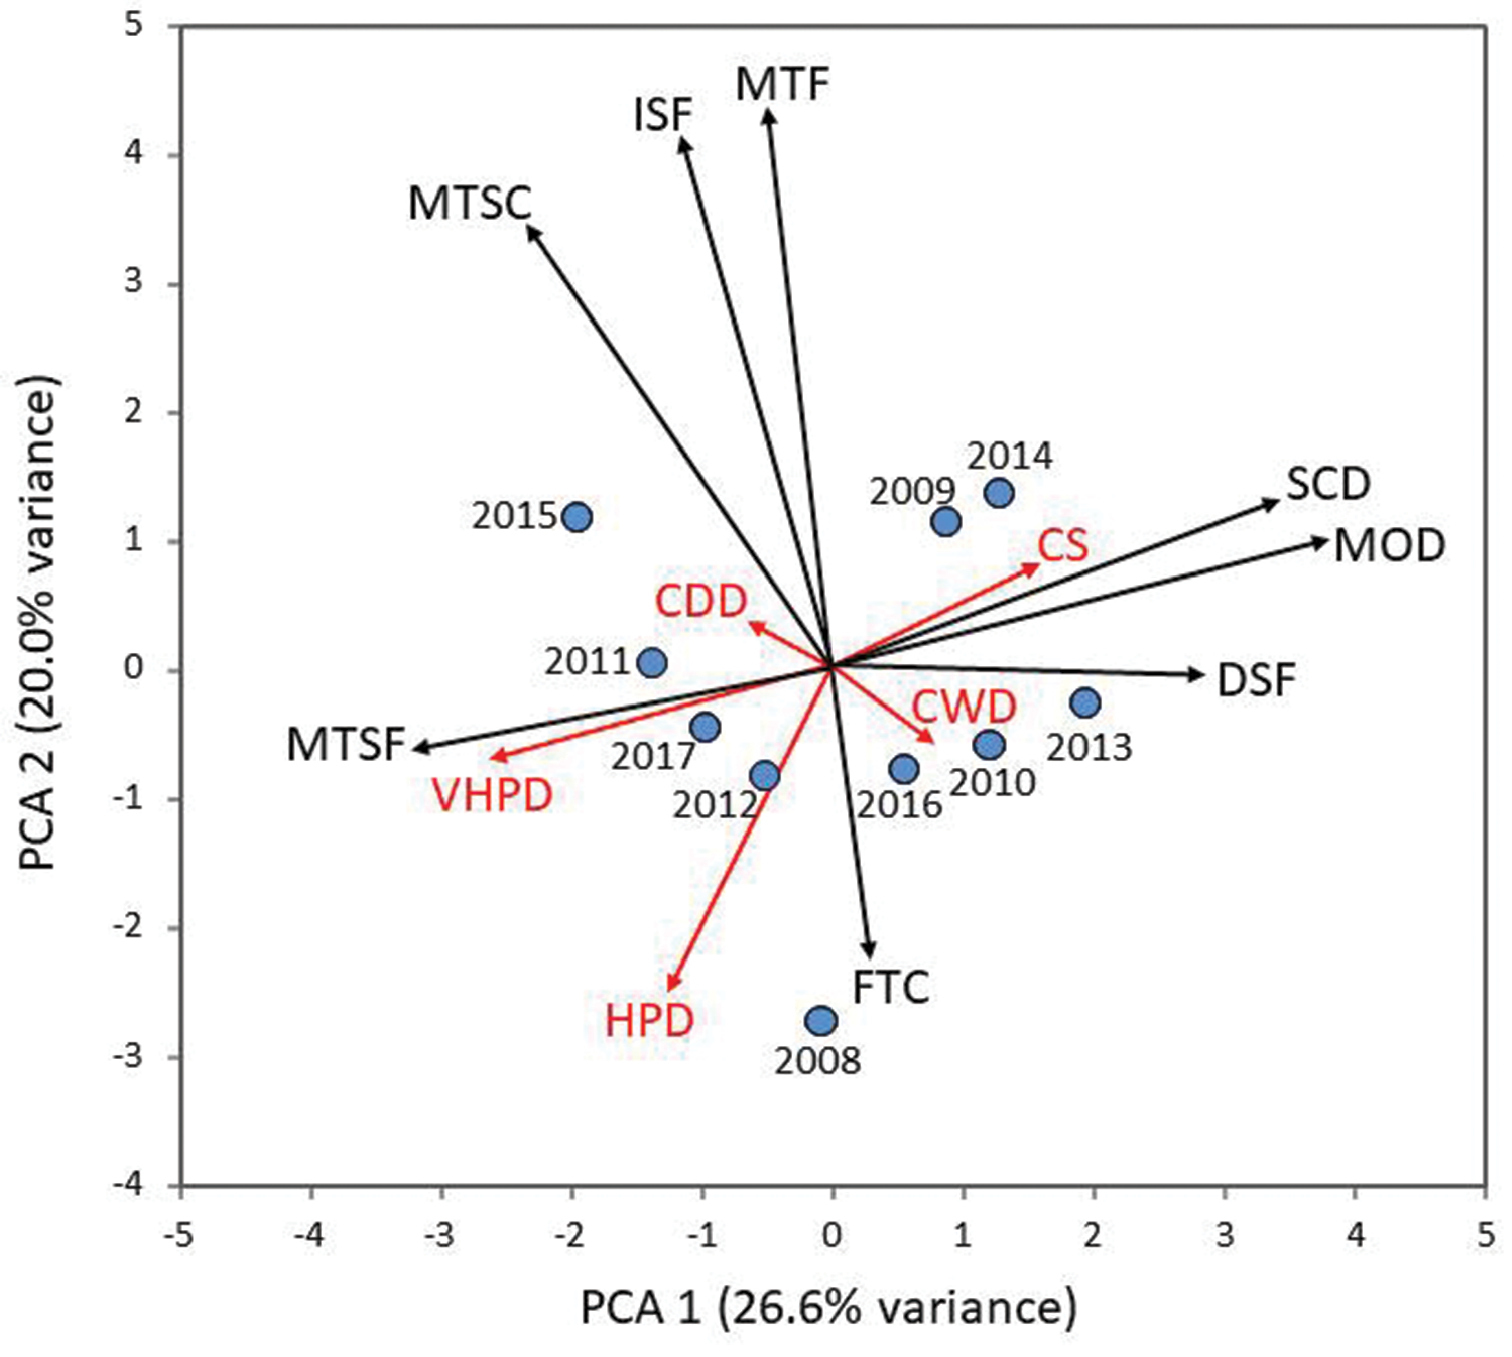
Principal Component Analysis showing the variation of climatic (red arrows) and pedoclimatic (black arrows) indices over the 10 studied years. Blue points represent the average coordinates of different sampling date and replicates within the same year. Descriptions for each climate and pedoclimate index can be found in Table 1.


  Part of: Freppaz M, Viglietti D, Balestrini R, Lonati M, Colombo N (2019) Climatic and pedoclimatic factors driving C and N dynamics in soil and surface water in the alpine tundra (NW-Italian Alps). In: Mazzocchi MG, Capotondi L, Freppaz M, Lugliè A, Campanaro A (Eds) Italian Long-Term Ecological Research for understanding ecosystem diversity and functioning. Case studies from aquatic, terrestrial and transitional domains. Nature Conservation 34: 67-90. https://doi.org/10.3897/natureconservation.34.30737