|
||
|
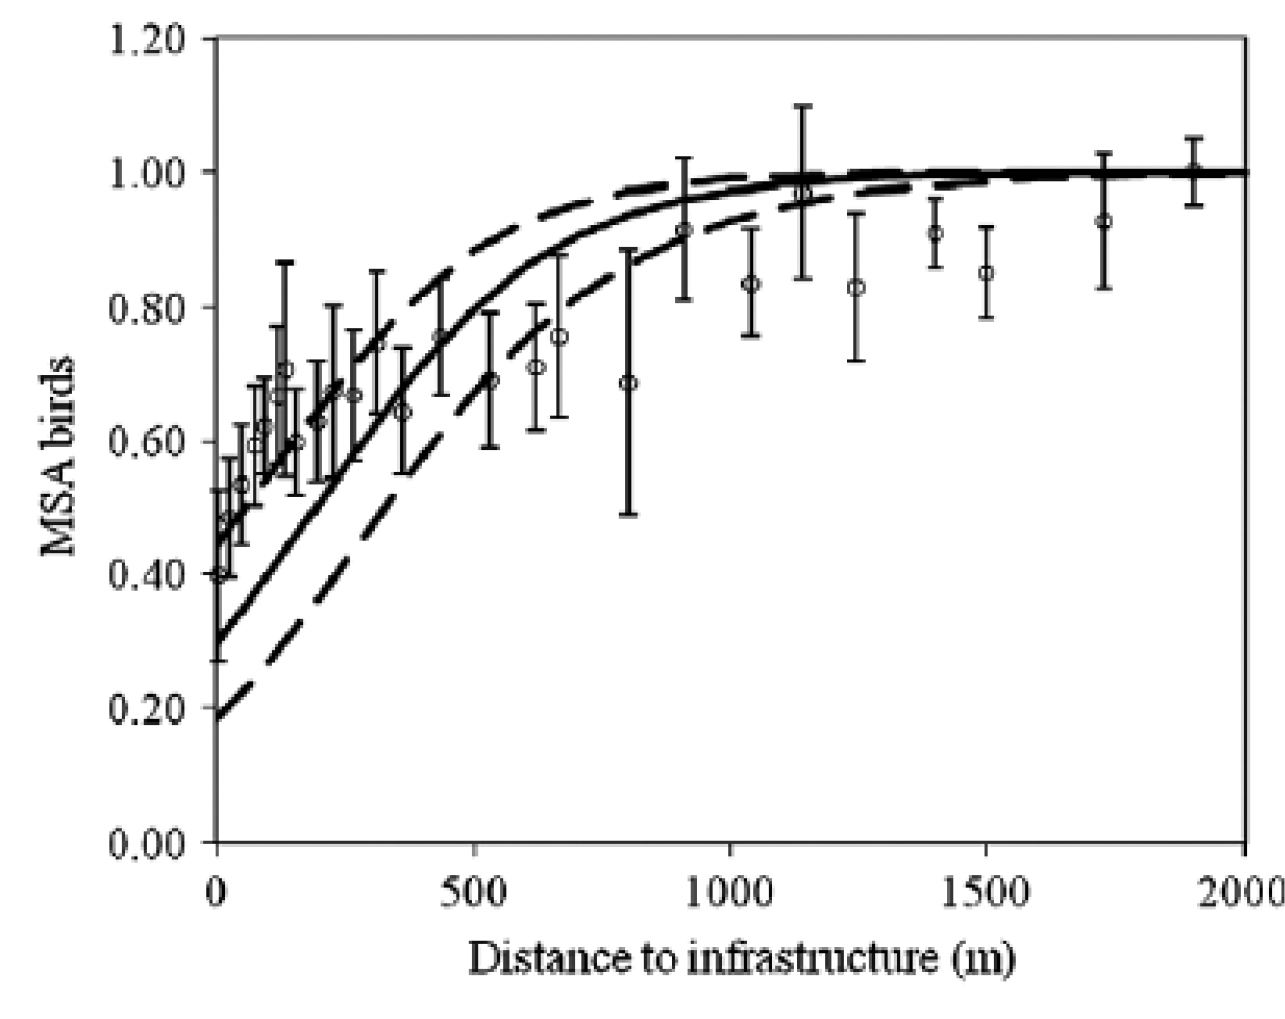
Mean species abundance (MSA) of birds as a function of distance to infrastructure (logistic regression). Open dots represent the pooled results of a meta-analysis per distance interval ±SE. The solid black line denotes the estimated curve for the decline of MSA in proximity to infrastructure; dashed lines are the 95% upper and lower limits of the confidence bands of the curve. Figure from Benítez-López et al. (2010). |