|
||
|
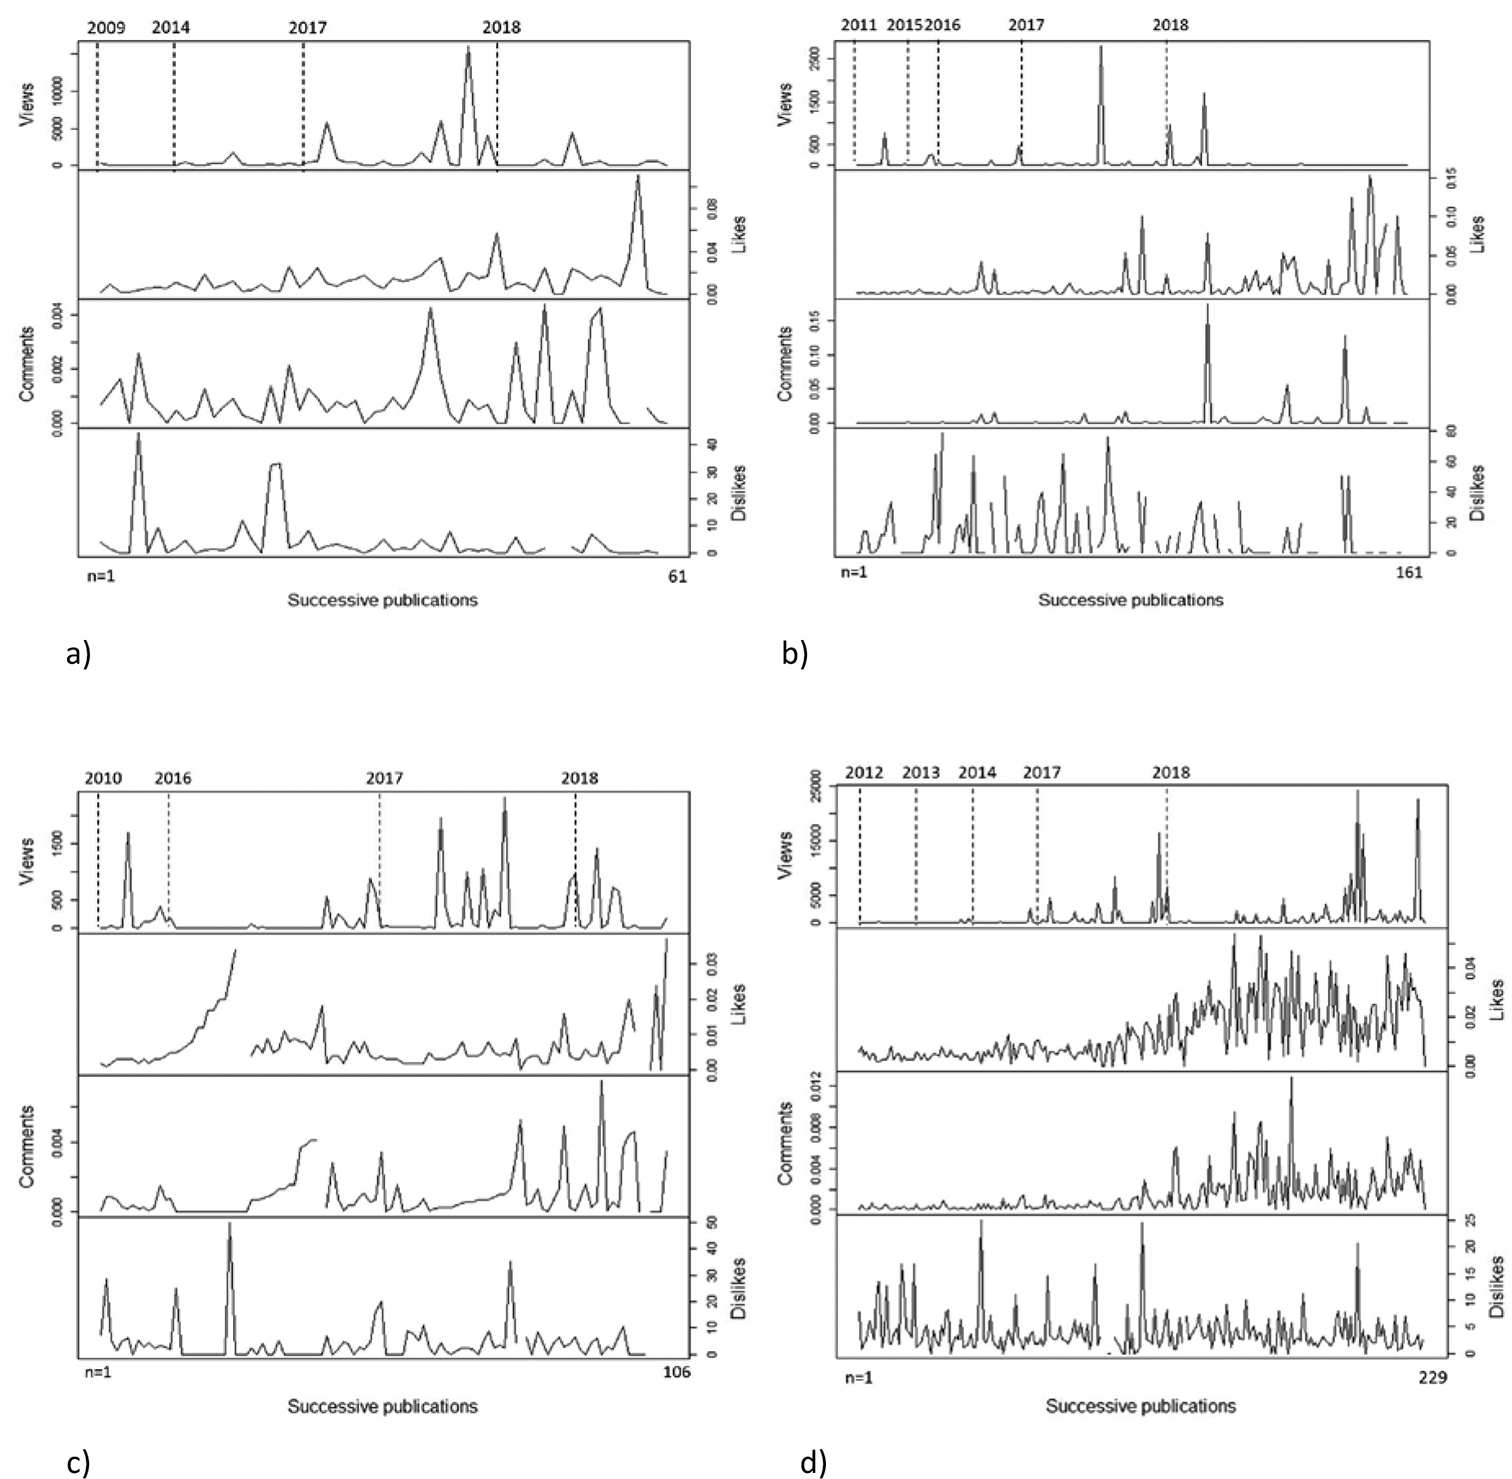
Time series plots showing successive publications of pet otter videos under a English language (n=61, 2009-2018) b Indonesian (n=161, 2011–2018) c Thai (n=106, 2010–2018), and d Japanese (n=229, 2012–2018) search terms (see Fig. 1). Views are views per day, Likes and Comments are like:view, comment:view ratios, respectively, and Dislikes are % dislikes relative to the total number of likes and dislikes (see Methods). Searches were carried out in November 2018, and each time series shown includes all YouTube videos published 30 days or more prior to the search date. Note that the time represented in each time series differs because the date of the first video published differed among search terms, and that the timeline is non-linear because increasing numbers of videos were published in each consecutive year (as shown in Fig. 1) – the year of the beginning of each time series, 2017 and 2018, and some of the earlier intervening years, are marked along the top of each graph. Missing values depicted in the graphs are due to the exclusion of peak values based on small sample size (counts of < 5 for likes, comments, or dislikes), or, for Dislikes, videos with 0 likes and 0 dislikes. |