|
||
|
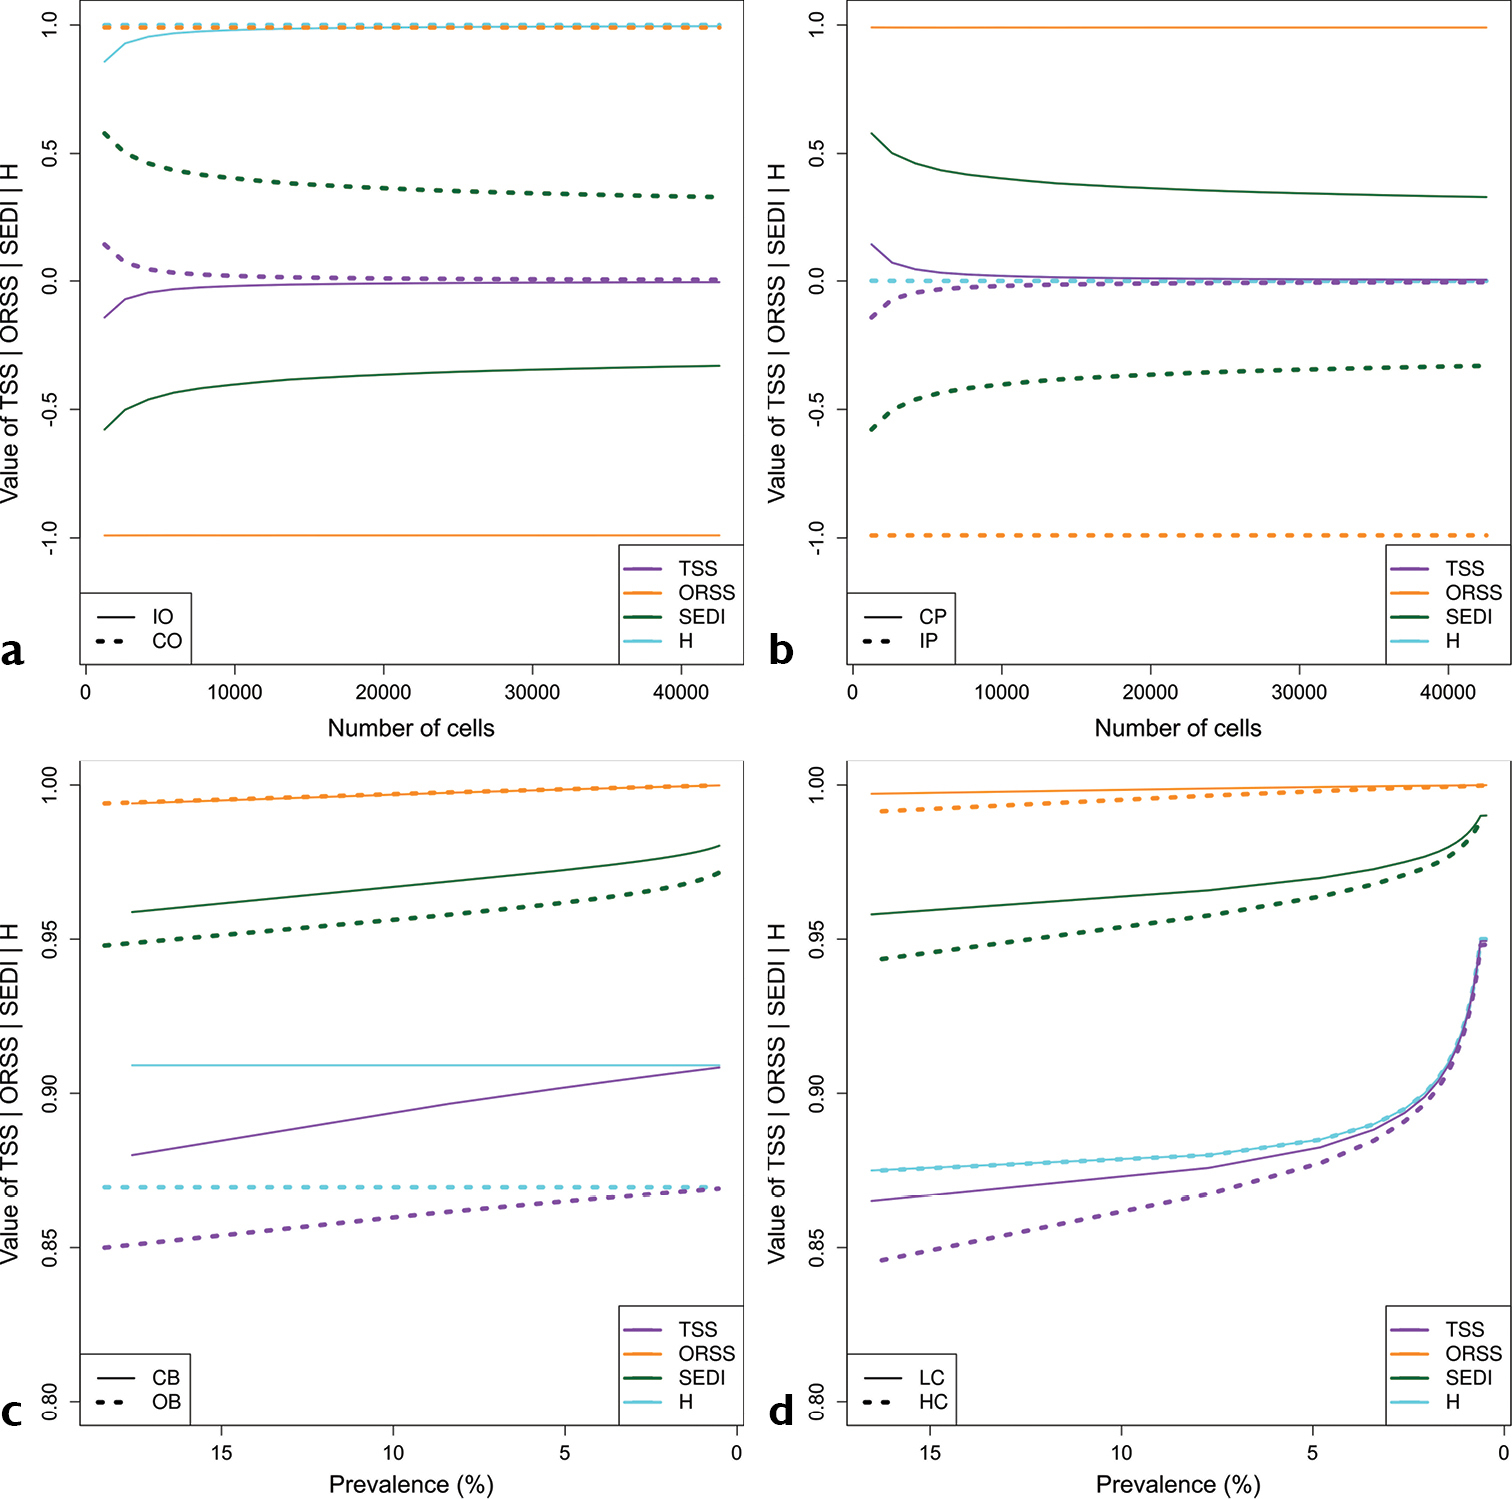
Plots of the values of hit rate (H), the True Skill Statistic (TSS), the Odds Ratio Skill Score (ORSS) and the Symmetric Extremal Dependence Score (SEDI) for all eight scenarios. Panels a, b, c, d display scenarios “Incorrectly Optimistic” and “Correctly Optimistic”, “Correctly Pessimistic” and “Incorrectly Pessimistic”, “Commission Bias” and “Omission Bias” and “Low Commission Rate” and “High Commission Rate”. In panels a and b, the x-axis denotes the log of the total number of cells, i.e. the size of the study area, whereas in panels c and d, the x-axis denotes prevalence (%). |