|
||
|
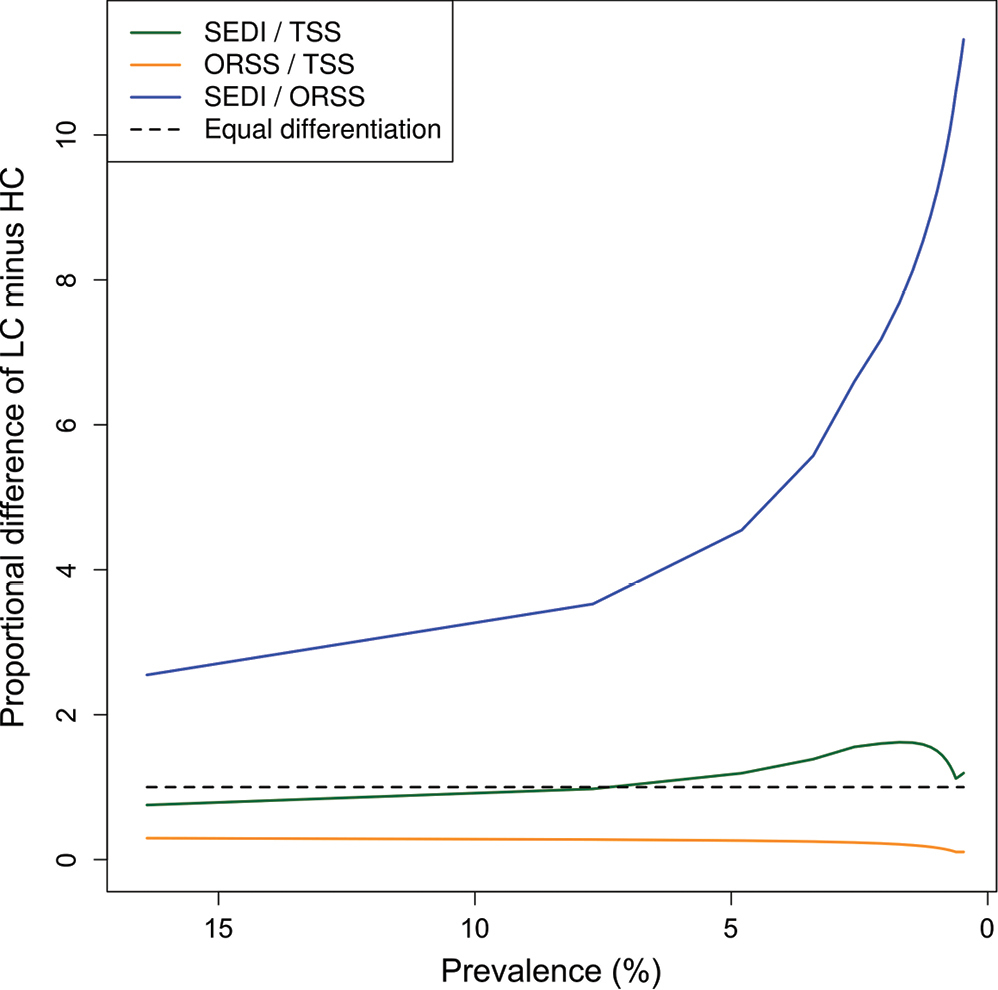
Proportional difference between scenarios “Low Commission Rate” (LC) and “High Commission Rate” (HC) for (in dark green) the Symmetric Extremal Dependence Score (SEDI) vs. the True Skill Statistic (TSS), (in orange) the Odds Ratio Skill Score (ORSS) vs. TSS and (in blue) SEDI vs. ORSS. The black, horizontal, dashed line represents equal differentiation. As there are slight differences in prevalence between scenarios LC and HC, the x-axis shows the mean prevalence for given cases across both scenarios. |