|
||
|
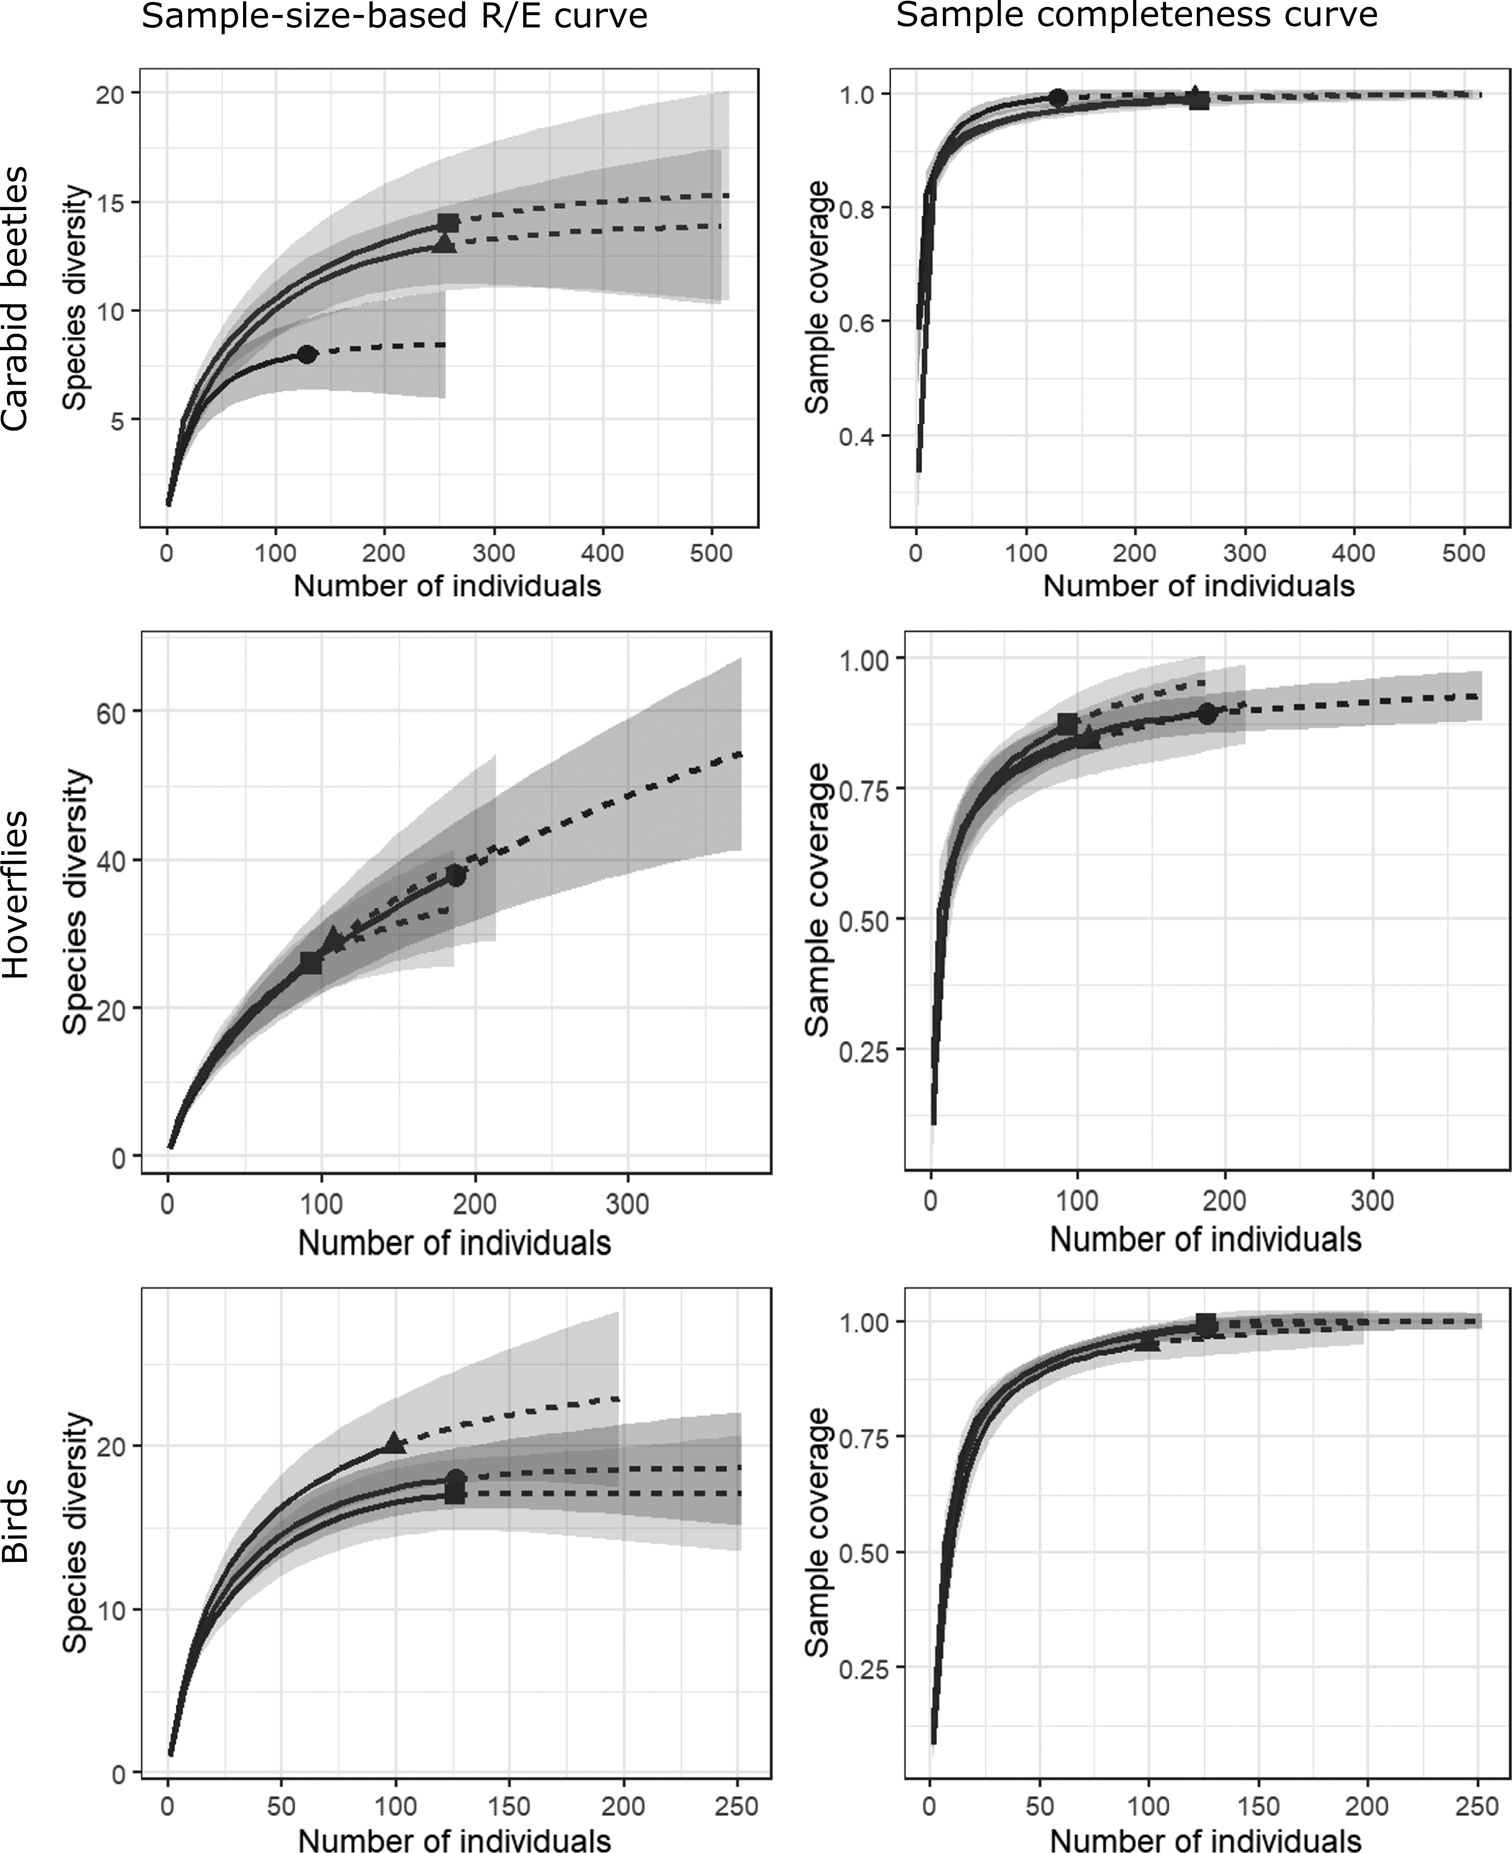
The rarefaction of carabid beetle, hoverfly and bird species richness for different altitudes. For each species group, the species-sample-based R/E curve and sample completeness curve is shown. The triangle shows the diversity in the lower belt, the quadrant shows the diversity in the middle belt and the circle shows the diversity in the highest belt. |