|
||
|
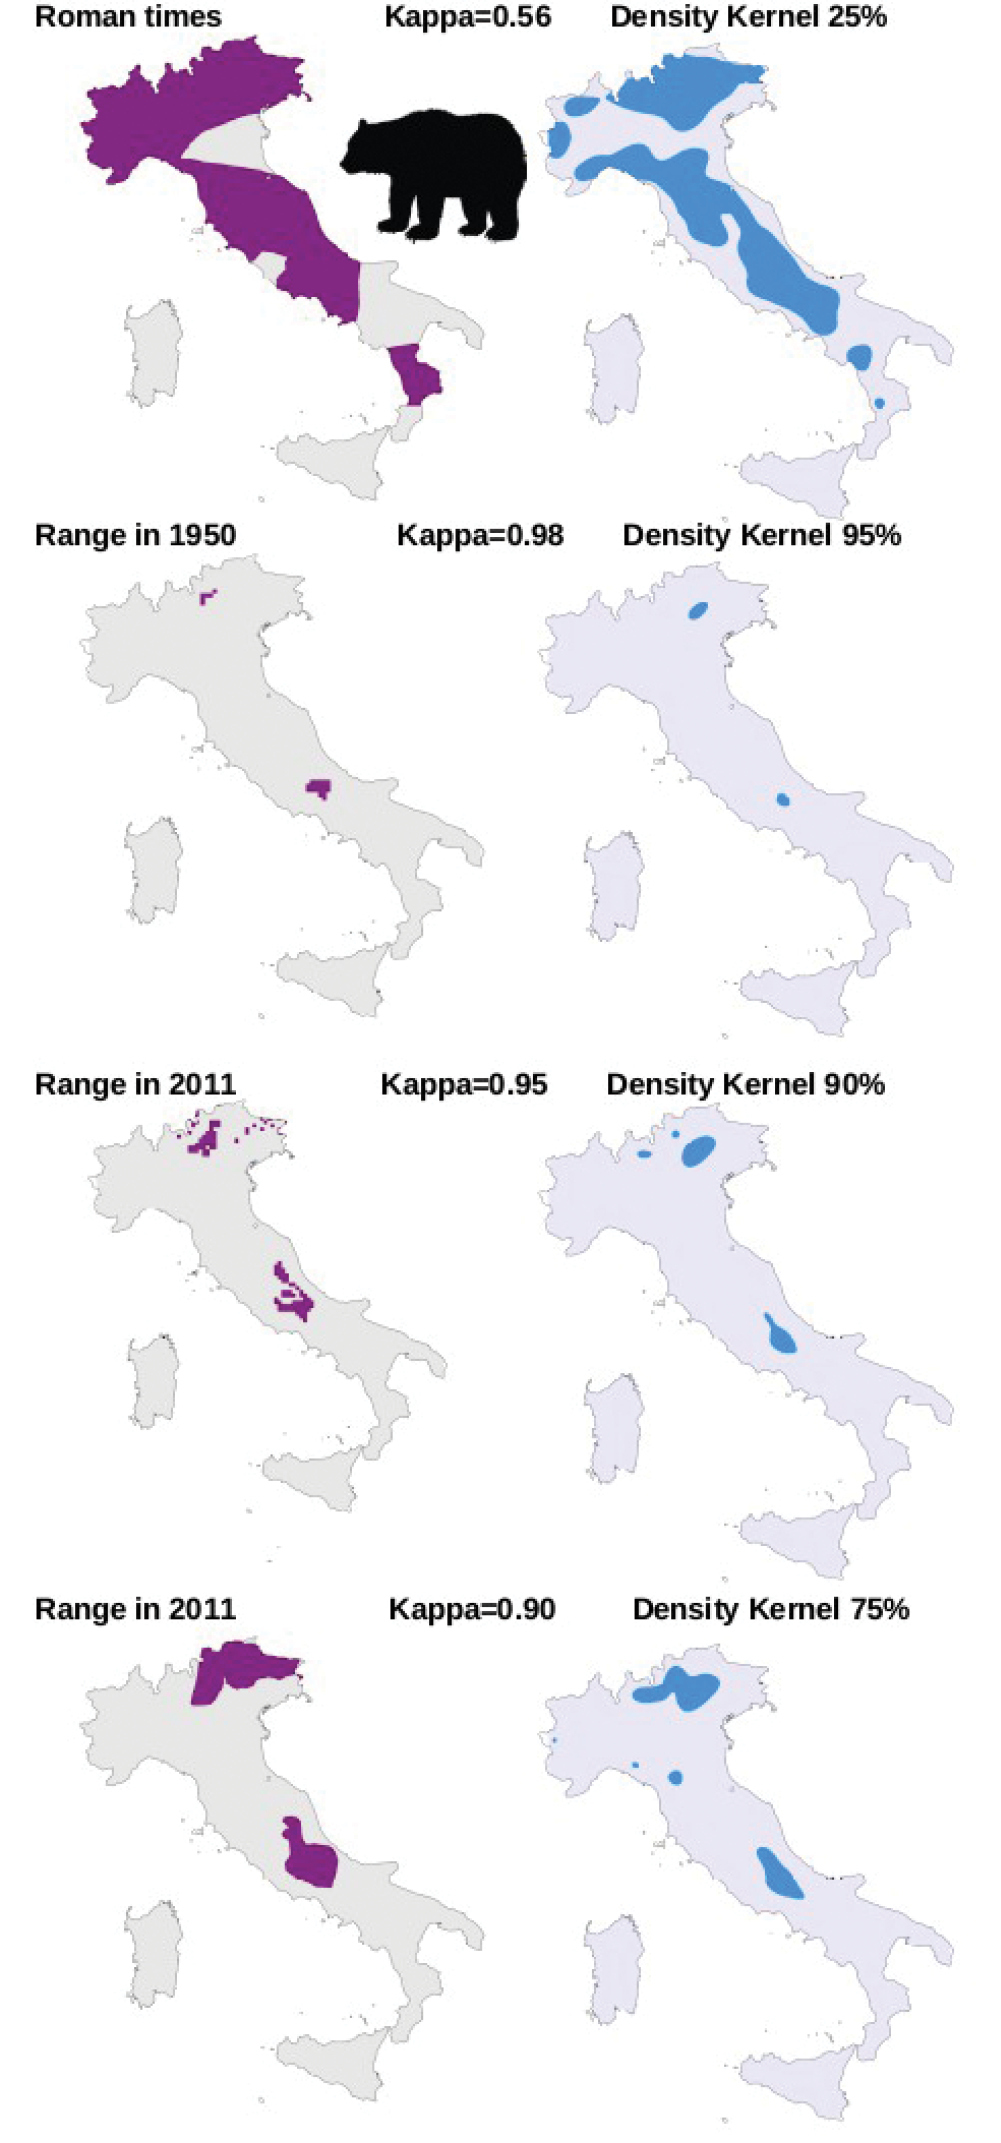
The maps on the left depict the historical ranges of occurrence of the wolf in Italy: the distributions in 1900, 1973 and 1985 were adapted from Randi et al. (2000) and the one in 2015 from Boitani et al. (2017). The isopleths of the best matching density kernel calculated from the toponyms are reported in the maps on the right. The thresholds of the density kernel and the Kappa parameter of overlapping are also reported for each pair of maps. |