|
||
|
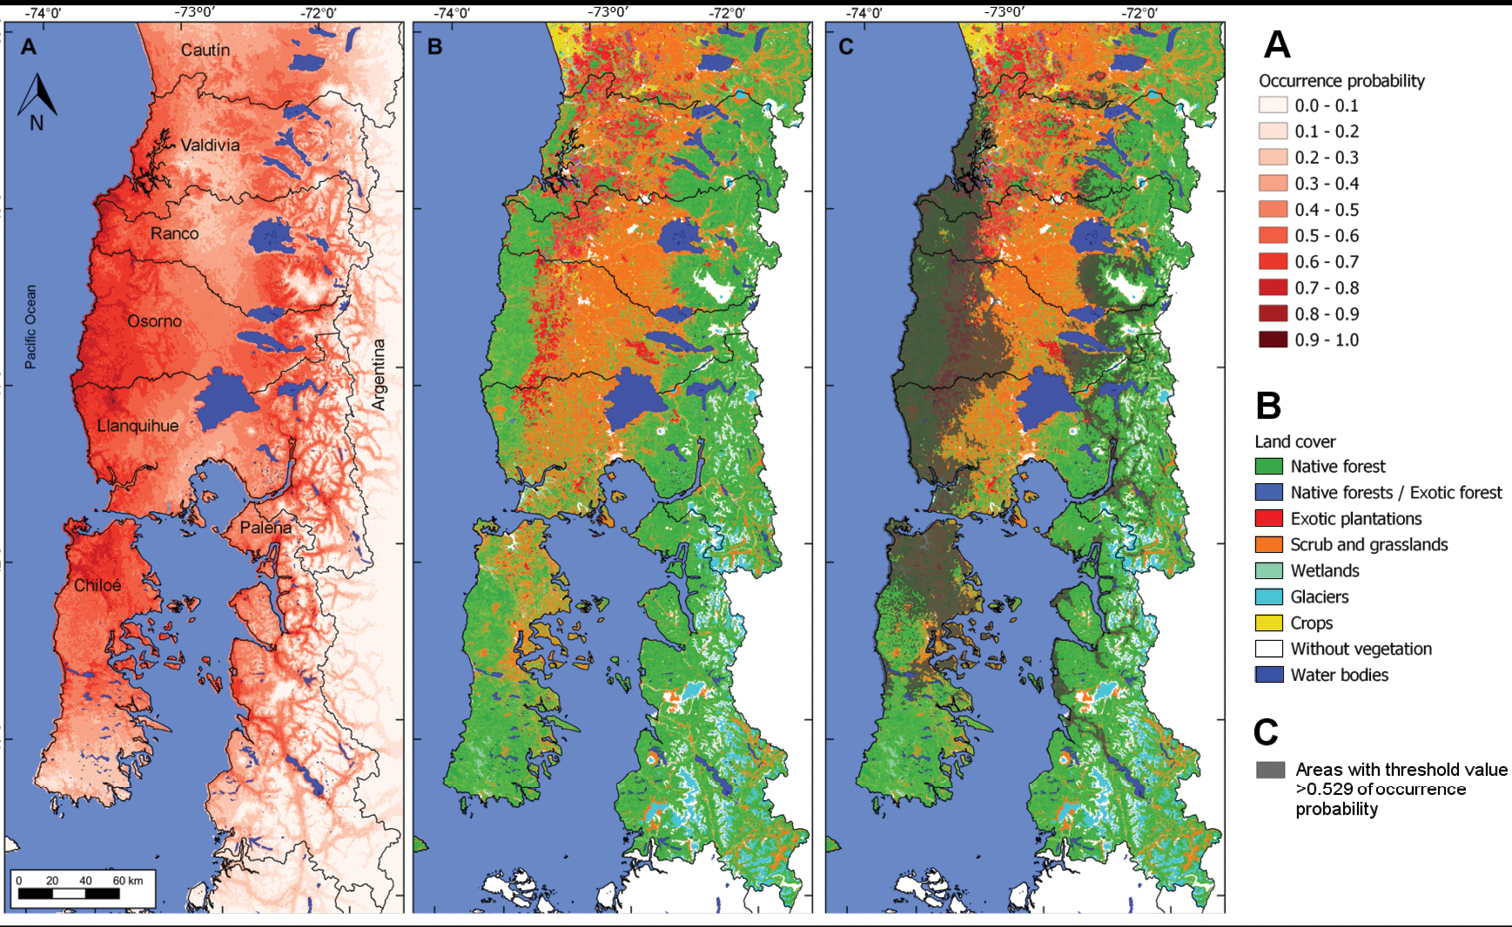
Projection of the fitted geographical distribution model of the Pudu deer in southern Chile. Projection under the current conditions (A), land use in the study area (B) and overlapping of suitable areas (grey areas) according to the SSS threshold value (> 0.529 of occurrence probability) on land use (C). In (A), red variations represent the predicted probability of suitable habitat conditions for the species. |