|
||
|
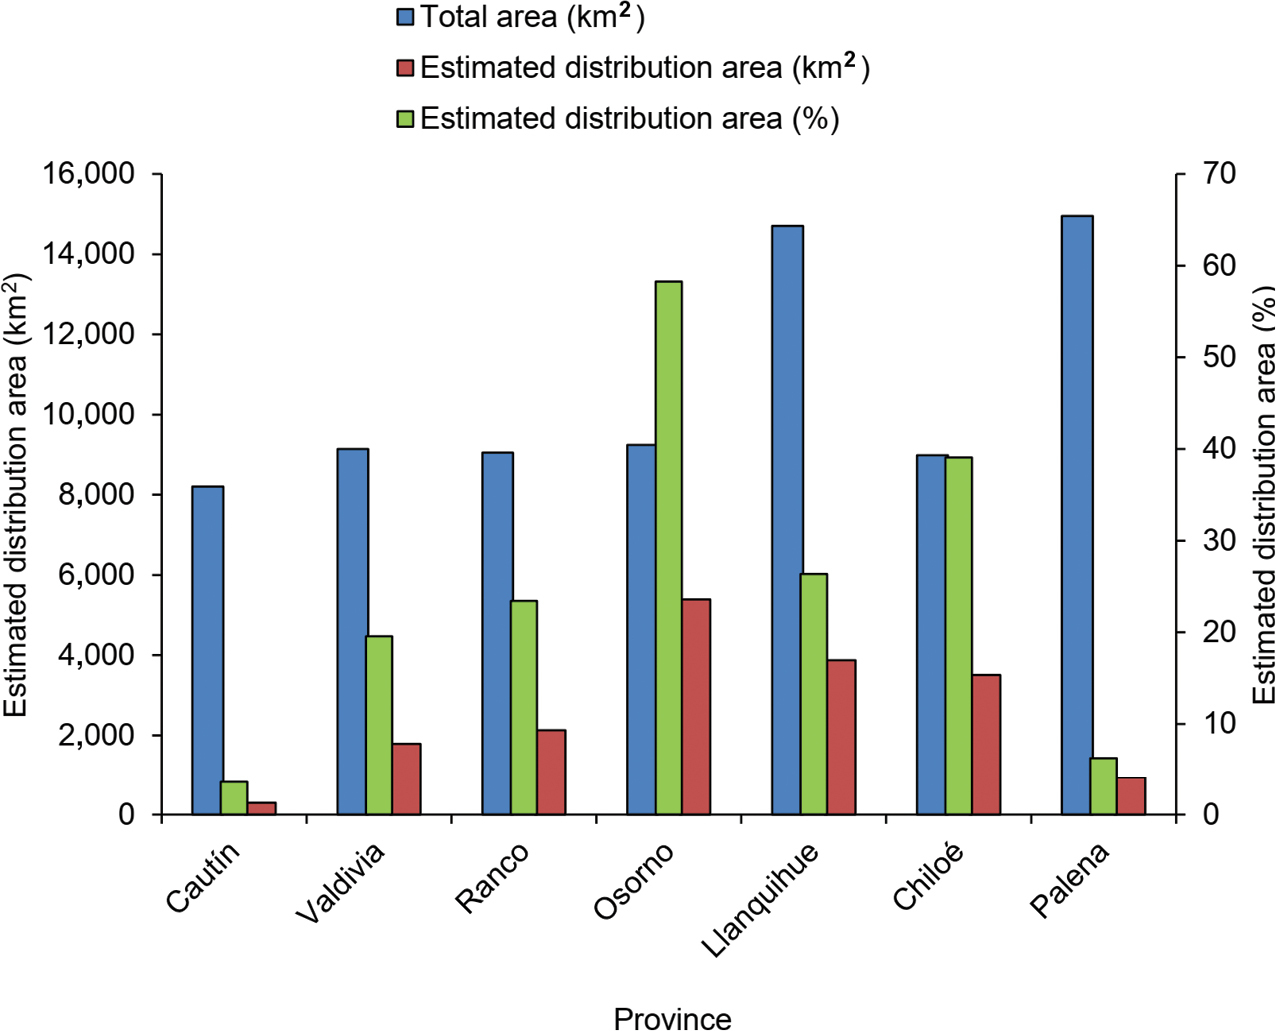
Bar chart representing the size of estimated current Pudu deer distribution areas in different Provinces of southern Chile. The estimated distribution area was determined as the areas with high probability of occurrence (> 0.529), based on the threshold that maximises the sum of sensitivity and specificity. Total areas of each Province and size of estimated distribution areas (km2) are shown. Percentage of estimated distribution area with respect to total area of the Province is also indicated. |