|
||
|
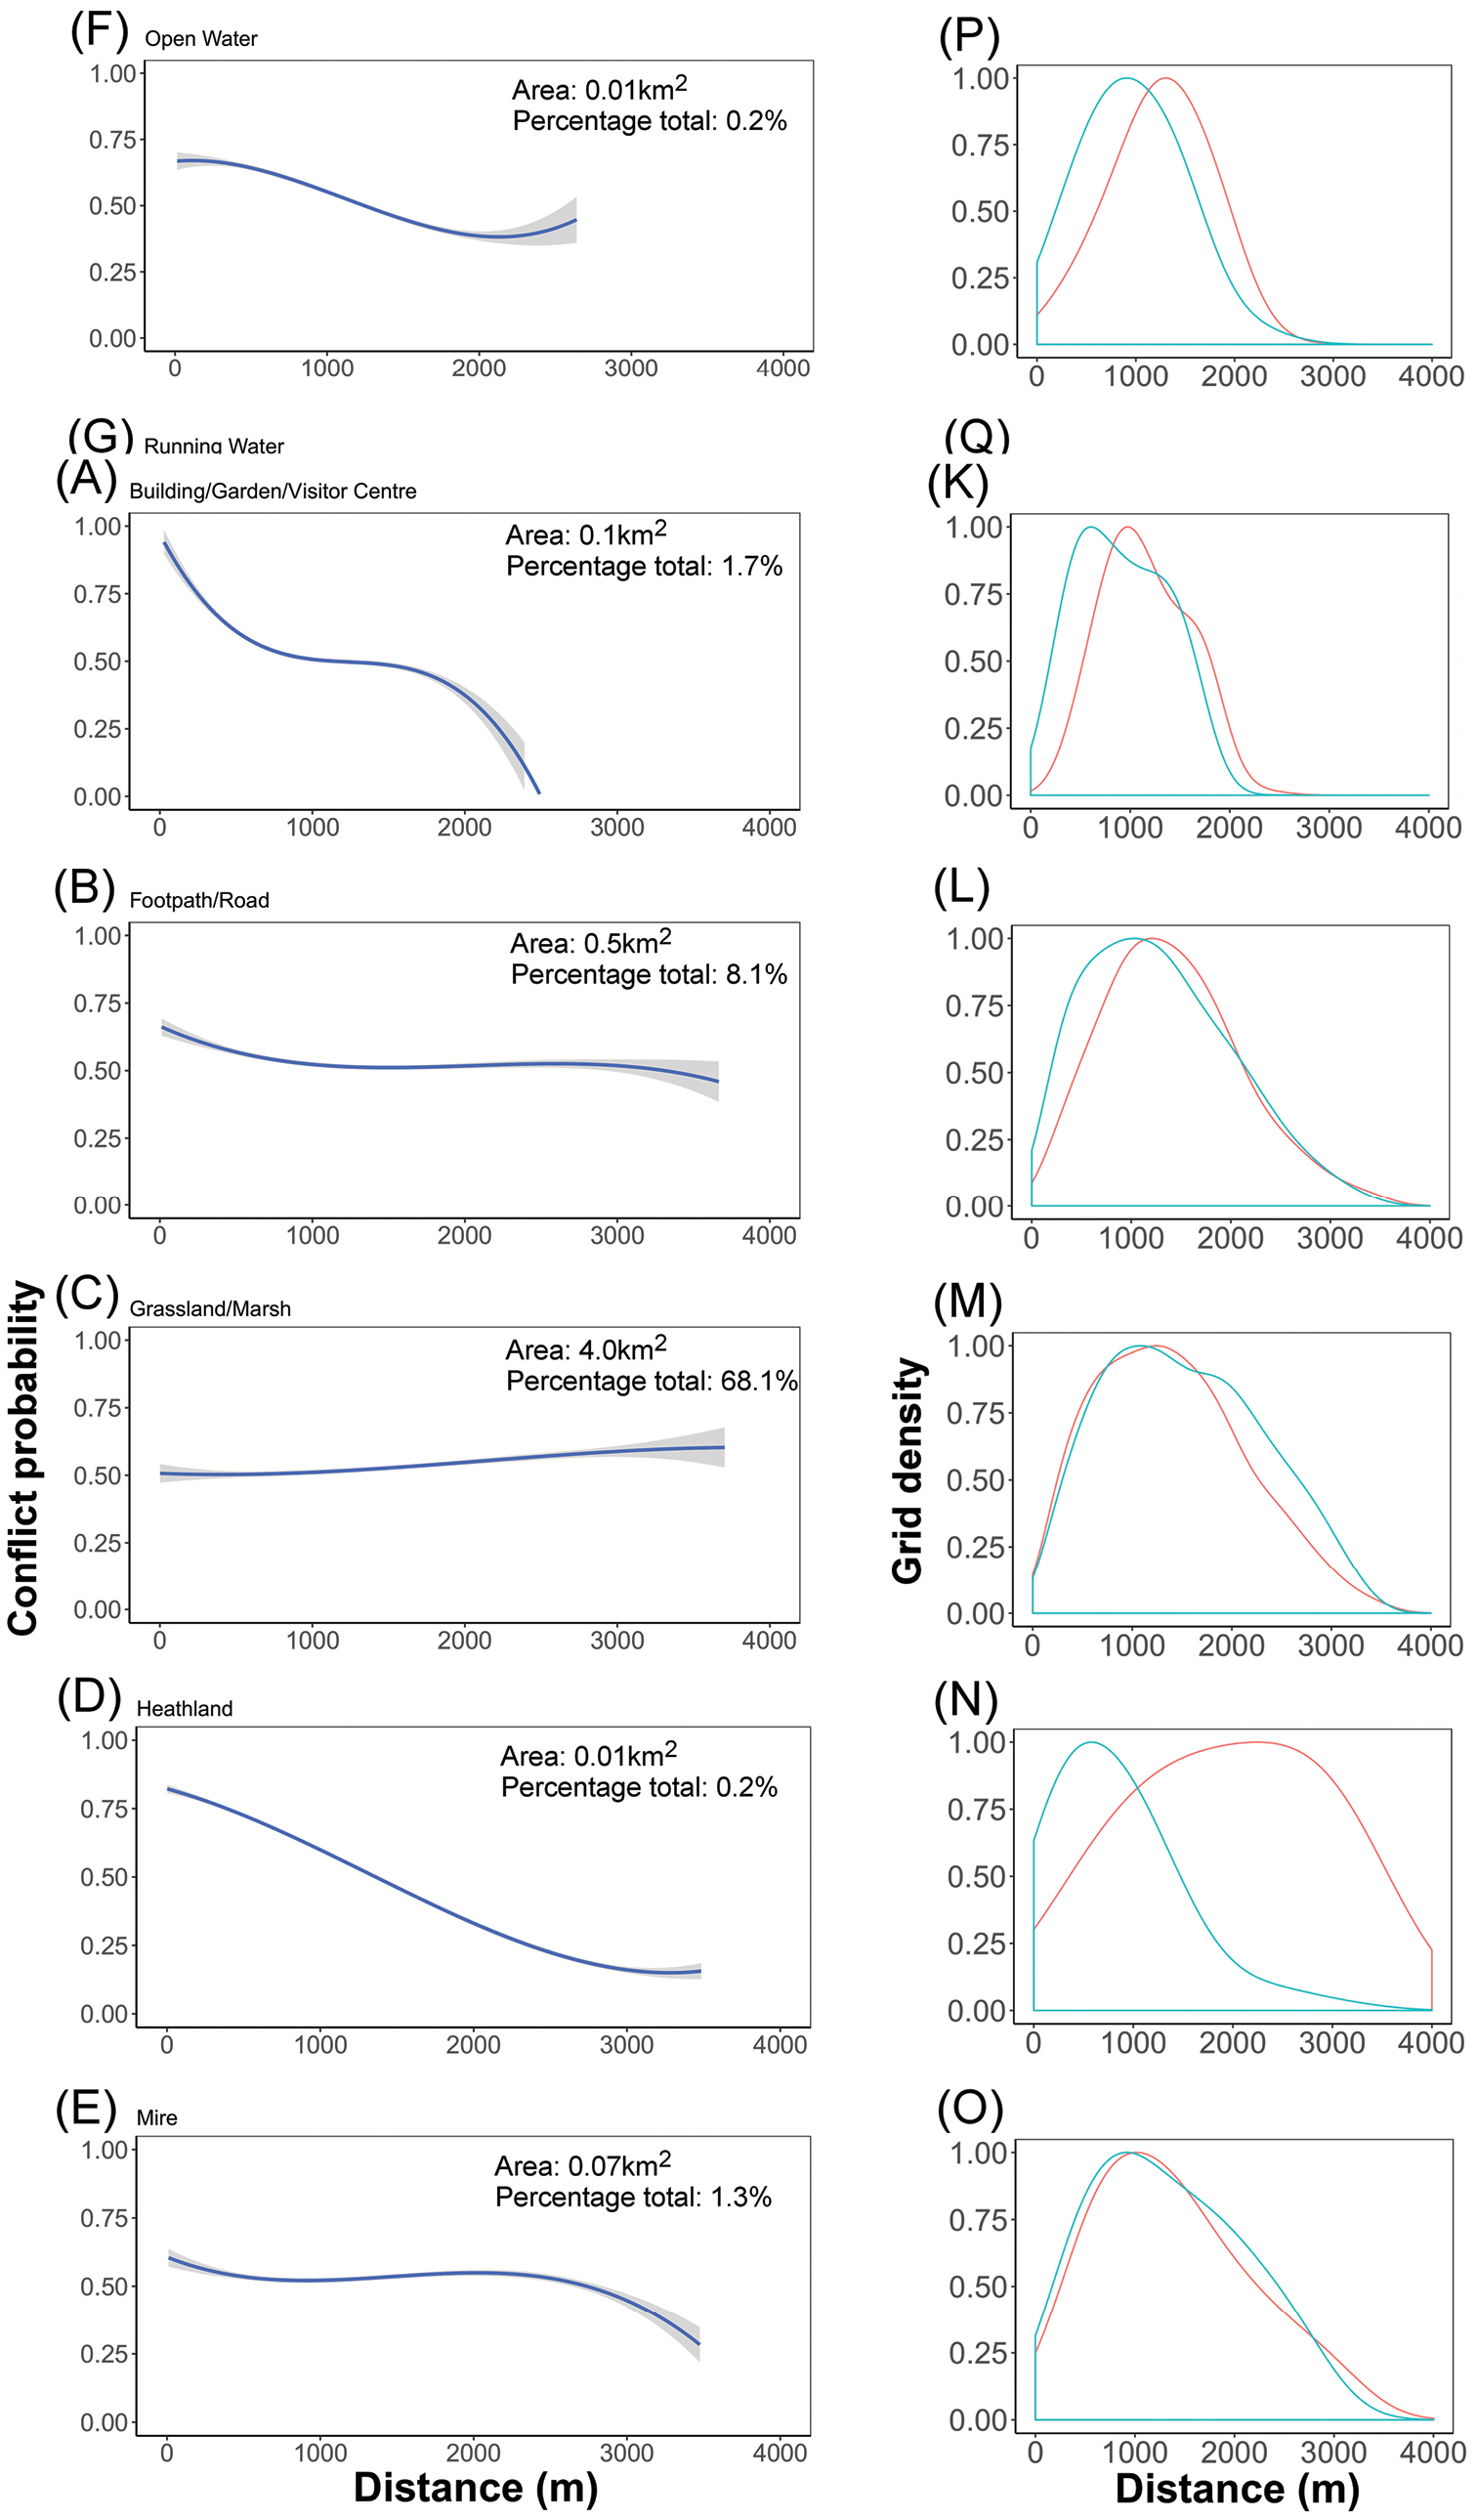
A–E human-deer (Cervus elaphus) encounter probability modelled with distance to each feature. The 95% confidence intervals are shown in grey K–O Density distribution of randomly sampled high-encounter points (blue) and low-encounter points (red) modelled with distance to each feature. Data collected from Lyme Park, Disley, UK, in 2018. |