|
||
|
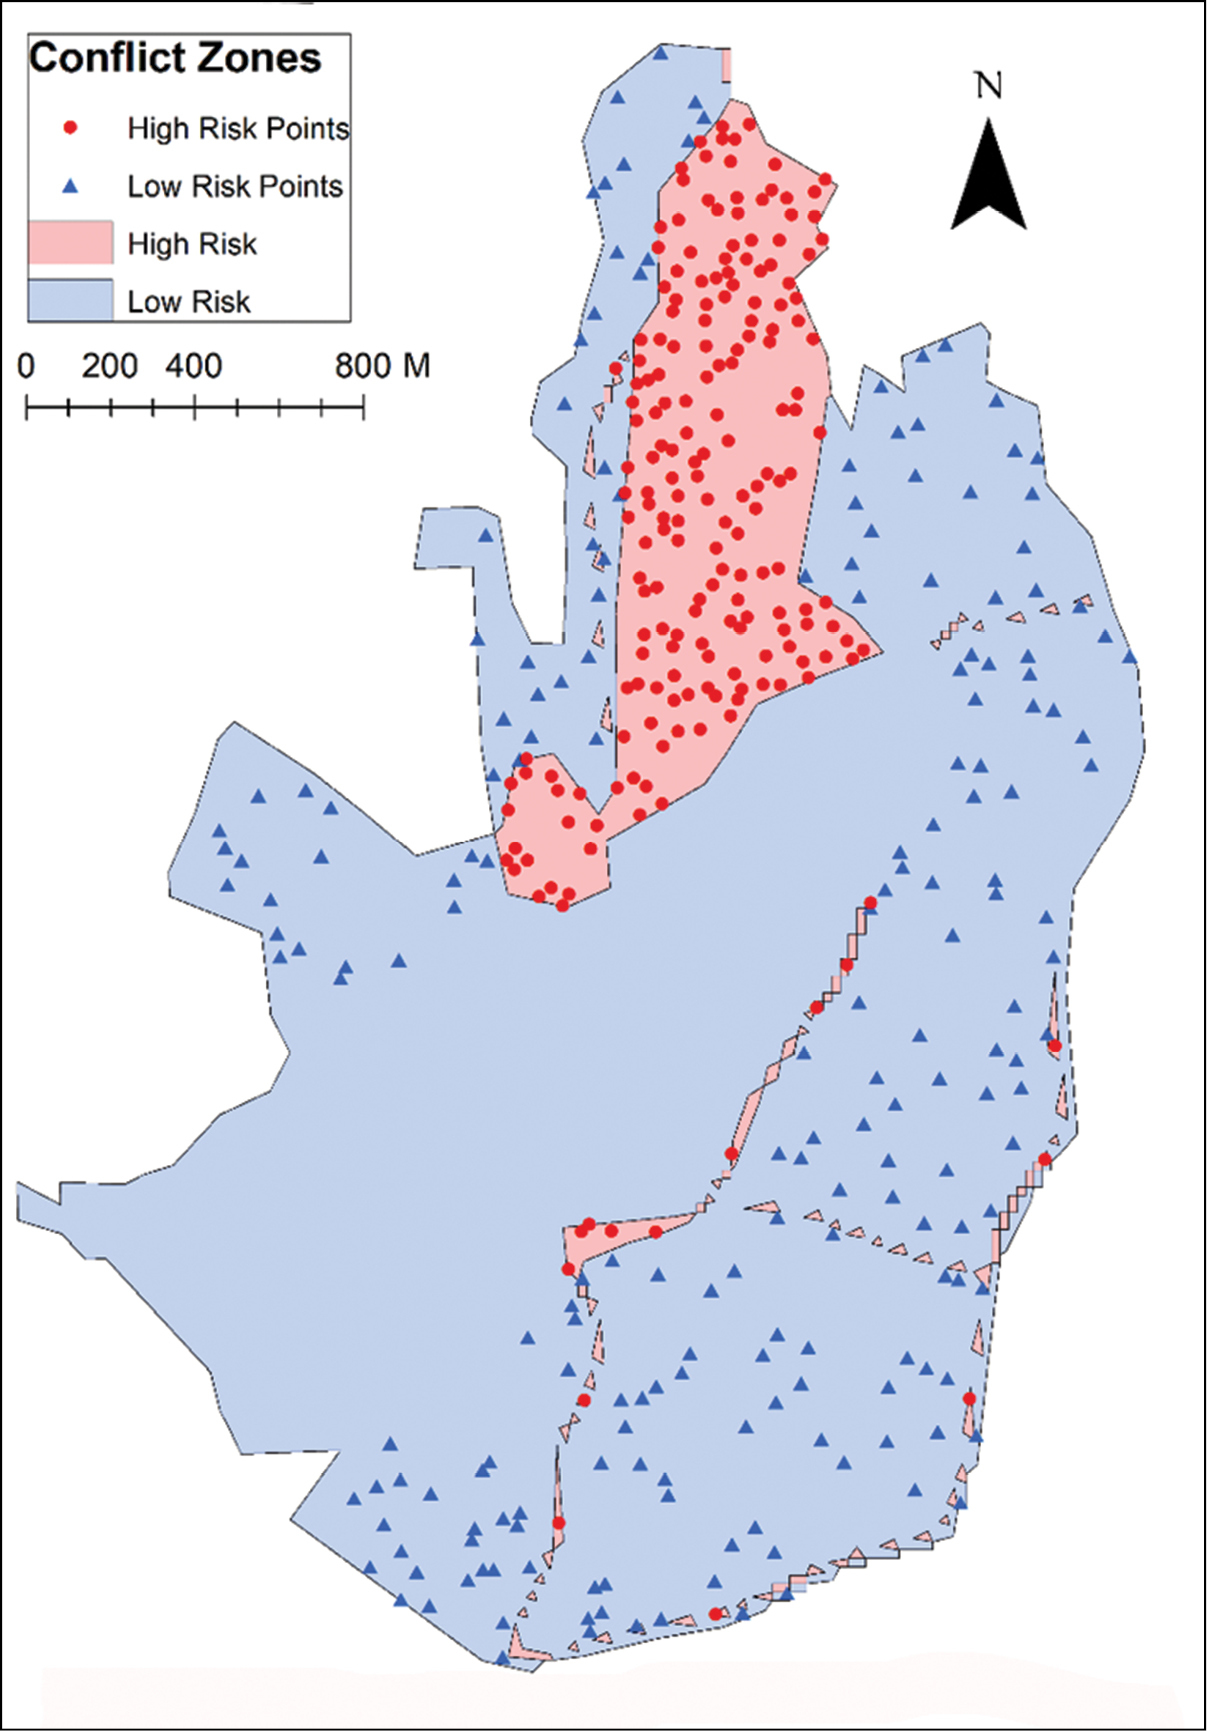
Map showing zones where human-deer (Cervus elaphus) encounters have occurred. Locations of randomly sampled points are shown as red dots (high risk points) and blue triangles (low risk points). Data collected from Lyme Park, Disley, UK, in 2018. |
|
||||||||
| Part of: Dixon G, Marriott AS, Stelfox G, Dunkerley C, Batke SP (2021) How do red deer react to increased visitor numbers? A case study on human-deer encounter probability and its effect on cortisol stress responses. Nature Conservation 43: 55-78. https://doi.org/10.3897/natureconservation.43.56266 |