|
||
|
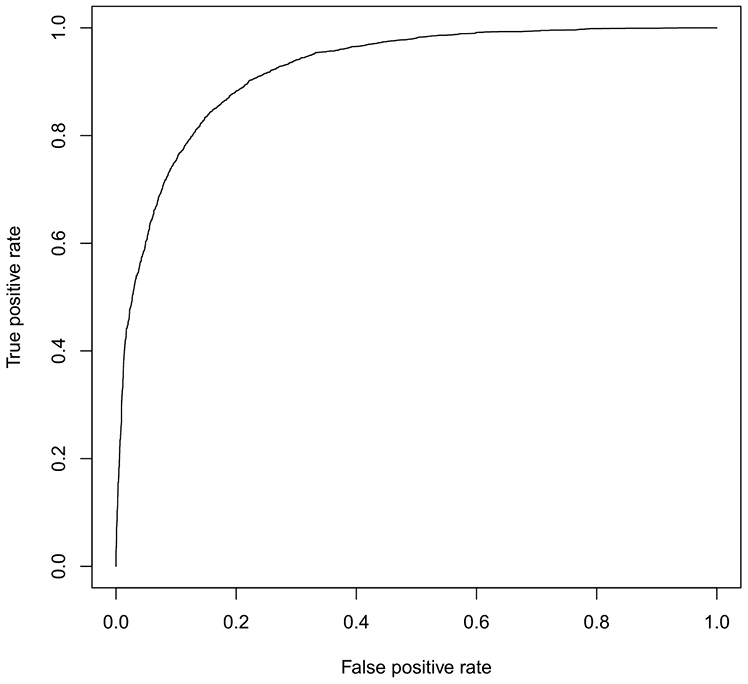
Receiver operating characteristic (ROC) curve showing the predictability of the human-deer (Cervus elaphus) encounter model. The true positive rate (sensitivity) is plotted as a function of the false positive rate (specificity). The area under the ROC curve was 0.92. Data collected from Lyme Park, Disley, UK, in 2018. |