|
||
|
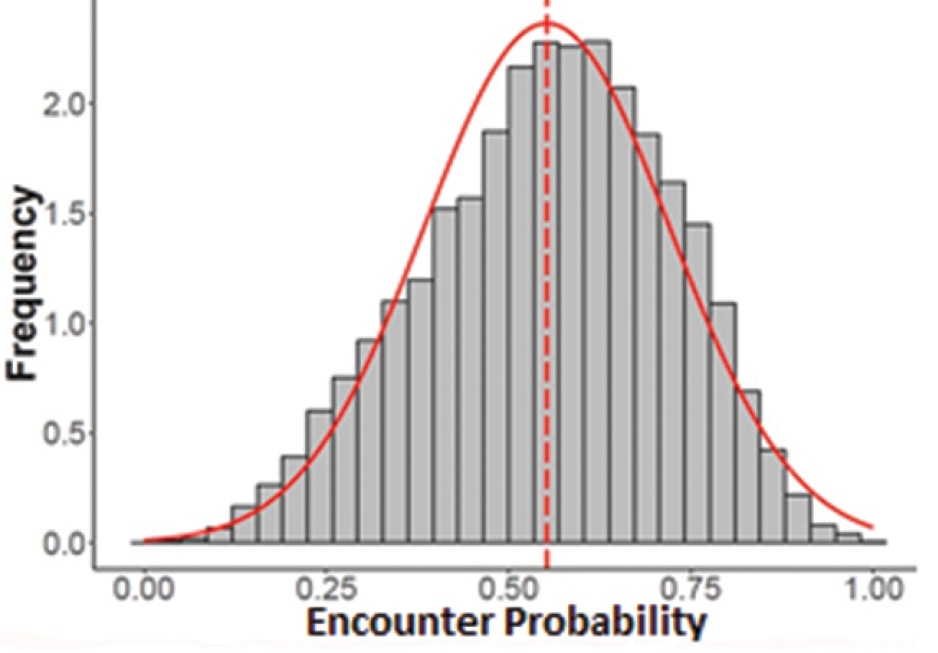
Frequency histogram showing encounter probability for all spatial grains (n=66,902). The y-axis is a proportional scale (2=3000). Data collected from Lyme Park, Disley, UK, in 2018. |
|
||||||||
| Part of: Dixon G, Marriott AS, Stelfox G, Dunkerley C, Batke SP (2021) How do red deer react to increased visitor numbers? A case study on human-deer encounter probability and its effect on cortisol stress responses. Nature Conservation 43: 55-78. https://doi.org/10.3897/natureconservation.43.56266 |