|
||
|
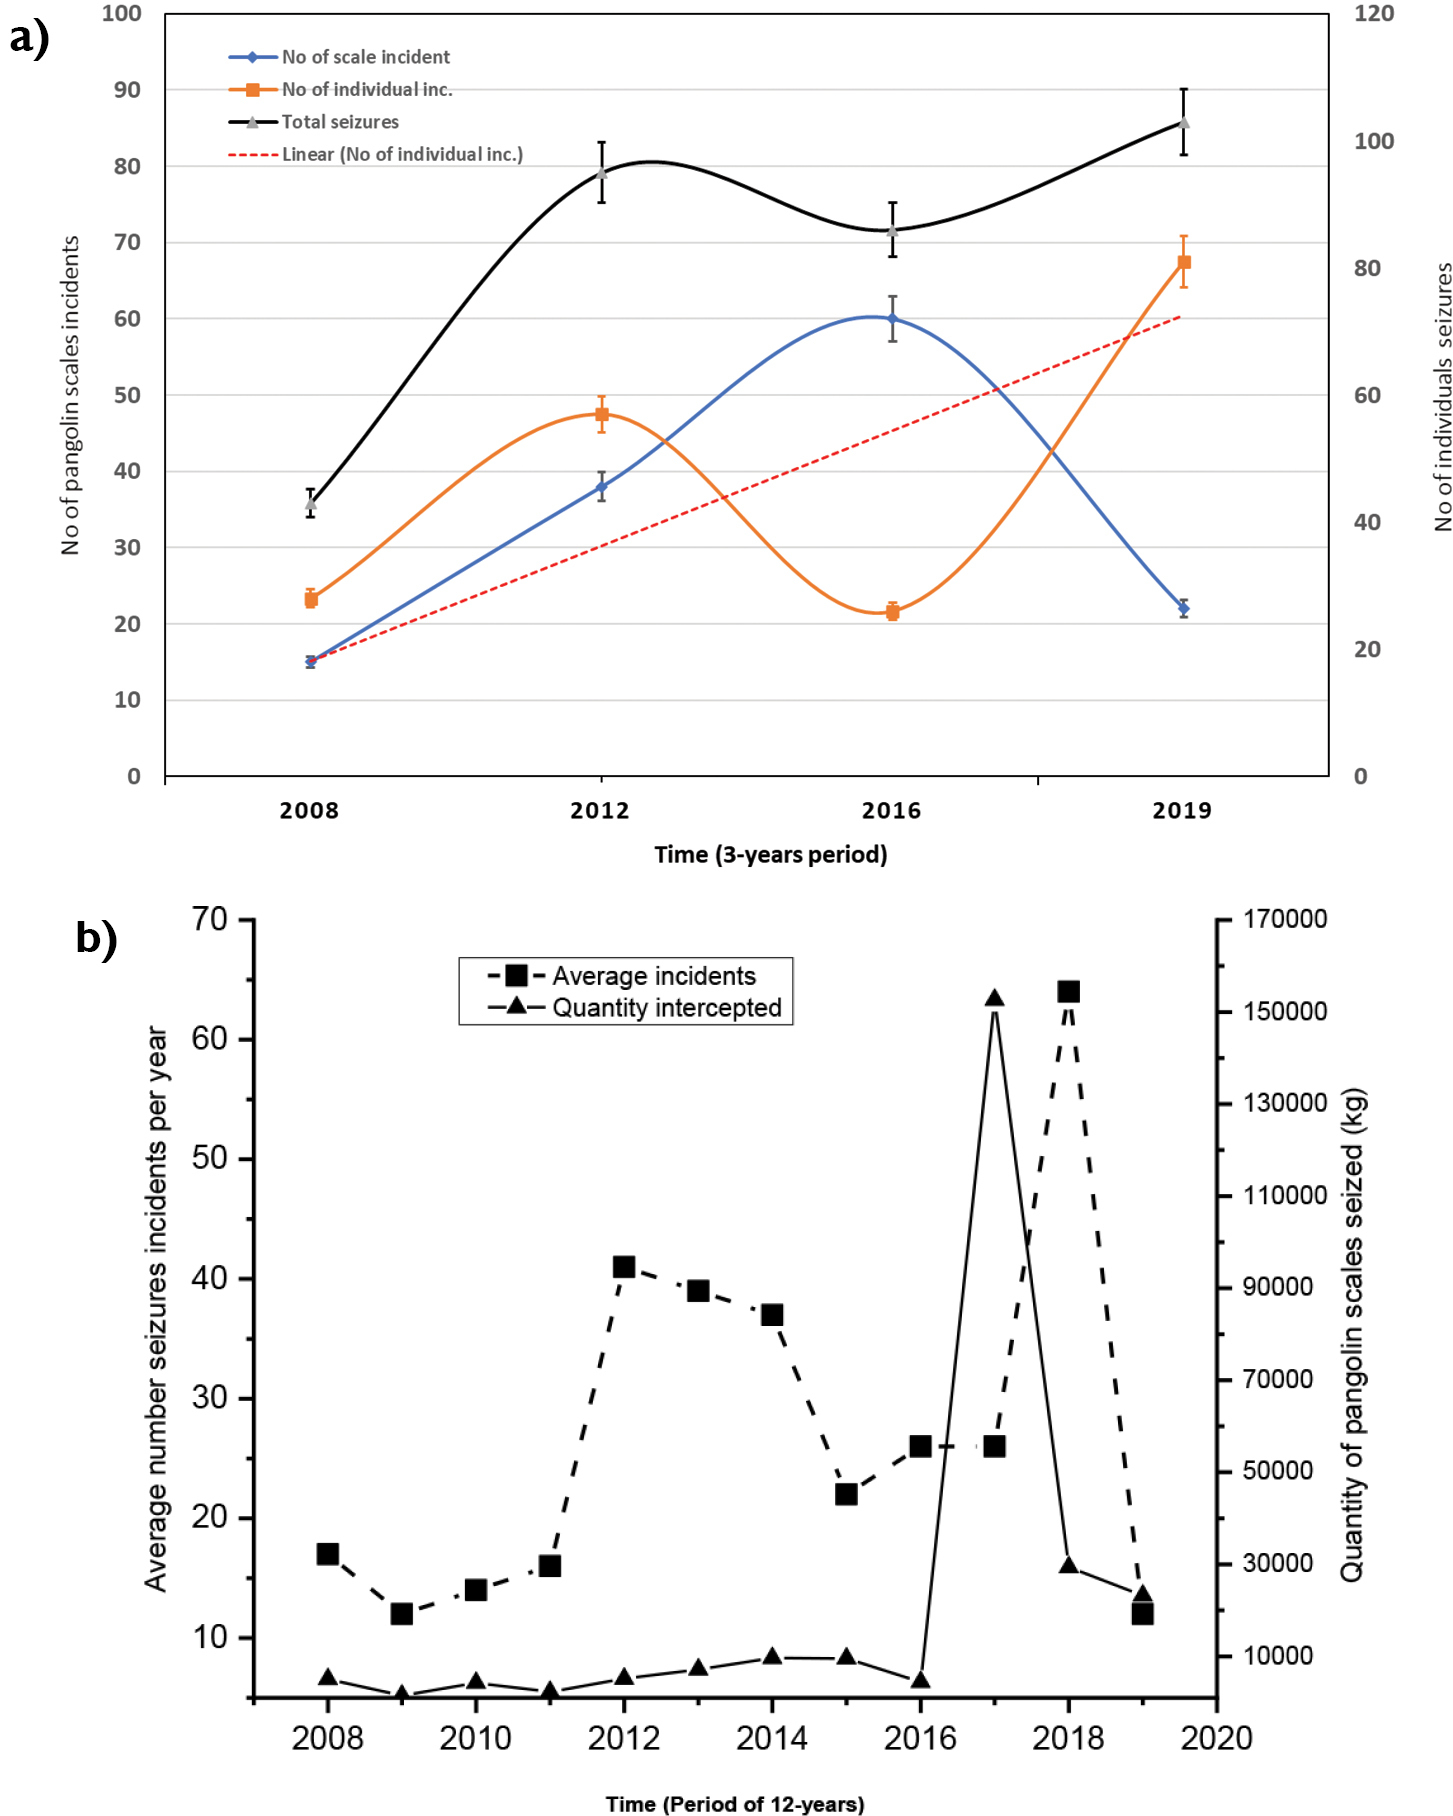
Plot of the mean number of scales seizures incidents (Blue); and mean number of individual pangolins seized (Brown square); the plot of linear (Dot-redline) shift in pangolin incidents per 3 years from January 2008 to December 2019 (a), and (b) the plot number of average seizures incidents (squares) and quantity of pangolin scales seized (triangles) in kilogram. |