|
||
|
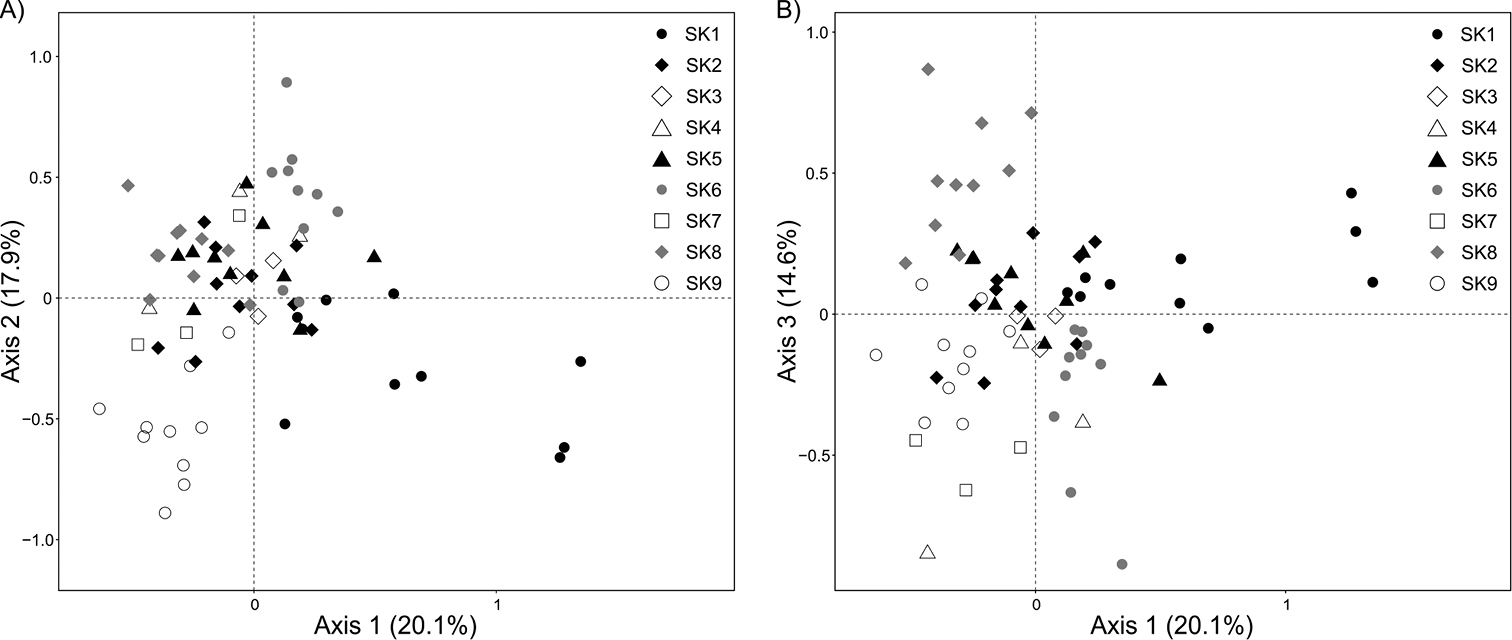
Two-dimensional plots of FCA performed for nine subpopulations showing the 1st and 2nd (A) and the 1st and 3rd (B) axes. The proportion of explained variance is written in parentheses on each axis. |
|
||||||||
| Part of: Kelemen KA, Urzi F, Buzan E, Horváth GF, Tulis F, Baláž I (2021) Genetic variability and conservation of the endangered Pannonian root vole in fragmented habitats of an agricultural landscape. Nature Conservation 43: 167-191. https://doi.org/10.3897/natureconservation.43.58798 |