|
||
|
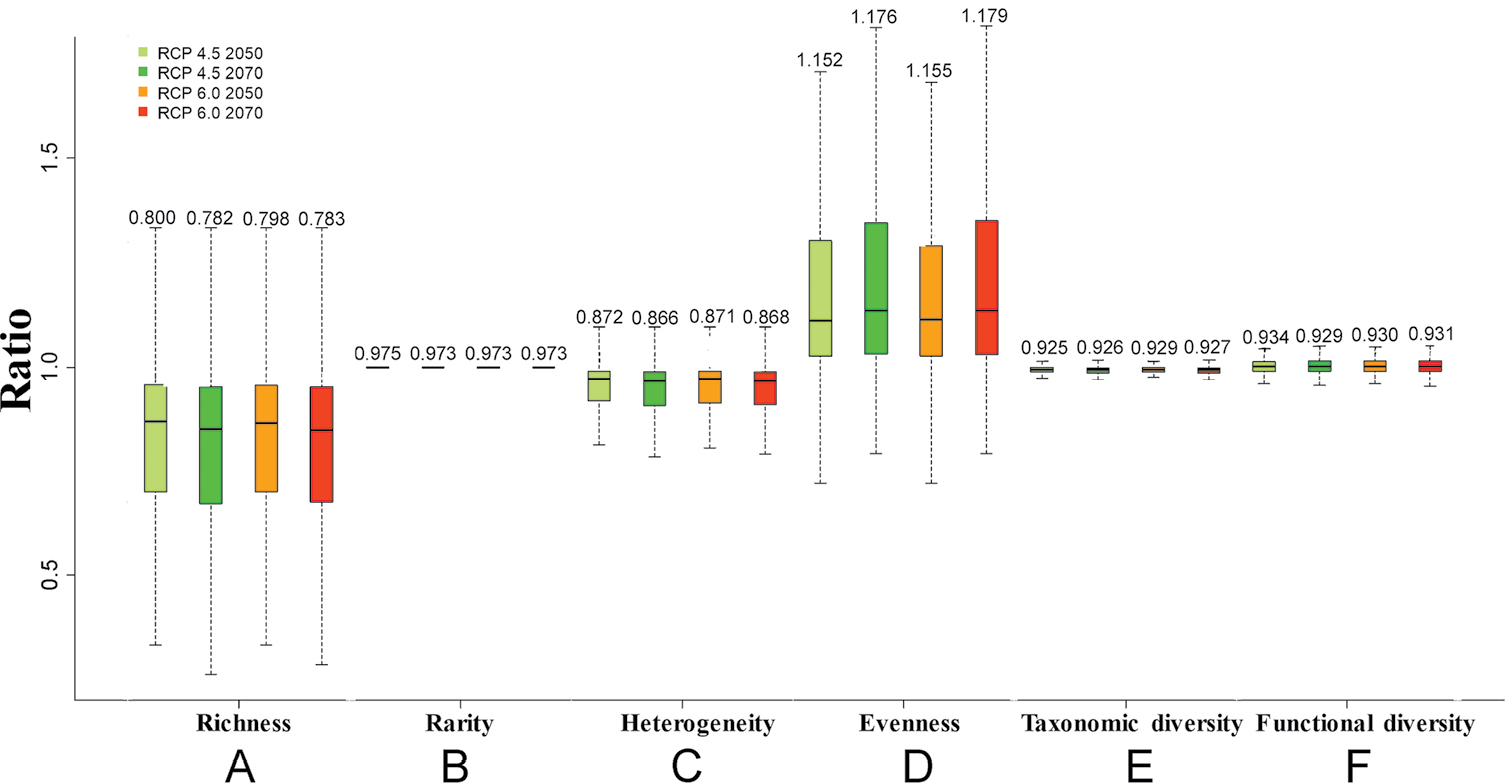
Boxplots of the rate of change in richness, rarity, heterogeneity (Shannon-Wiener), evenness (Simpson evenness), taxonomic diversity (taxonomic distinctness) and functional diversity (functional richness) in each river basin, as predicted for the years 2050 (RCP 4.5 scenario) and 2070 (RCP 6.0 scenario). A value less than 1 means that the Diversity Index is lower in the future scenarios than in the present and vice versa. Outliers are not shown in the boxplots. The numbers indicate median values for all river basins. |