|
||
|
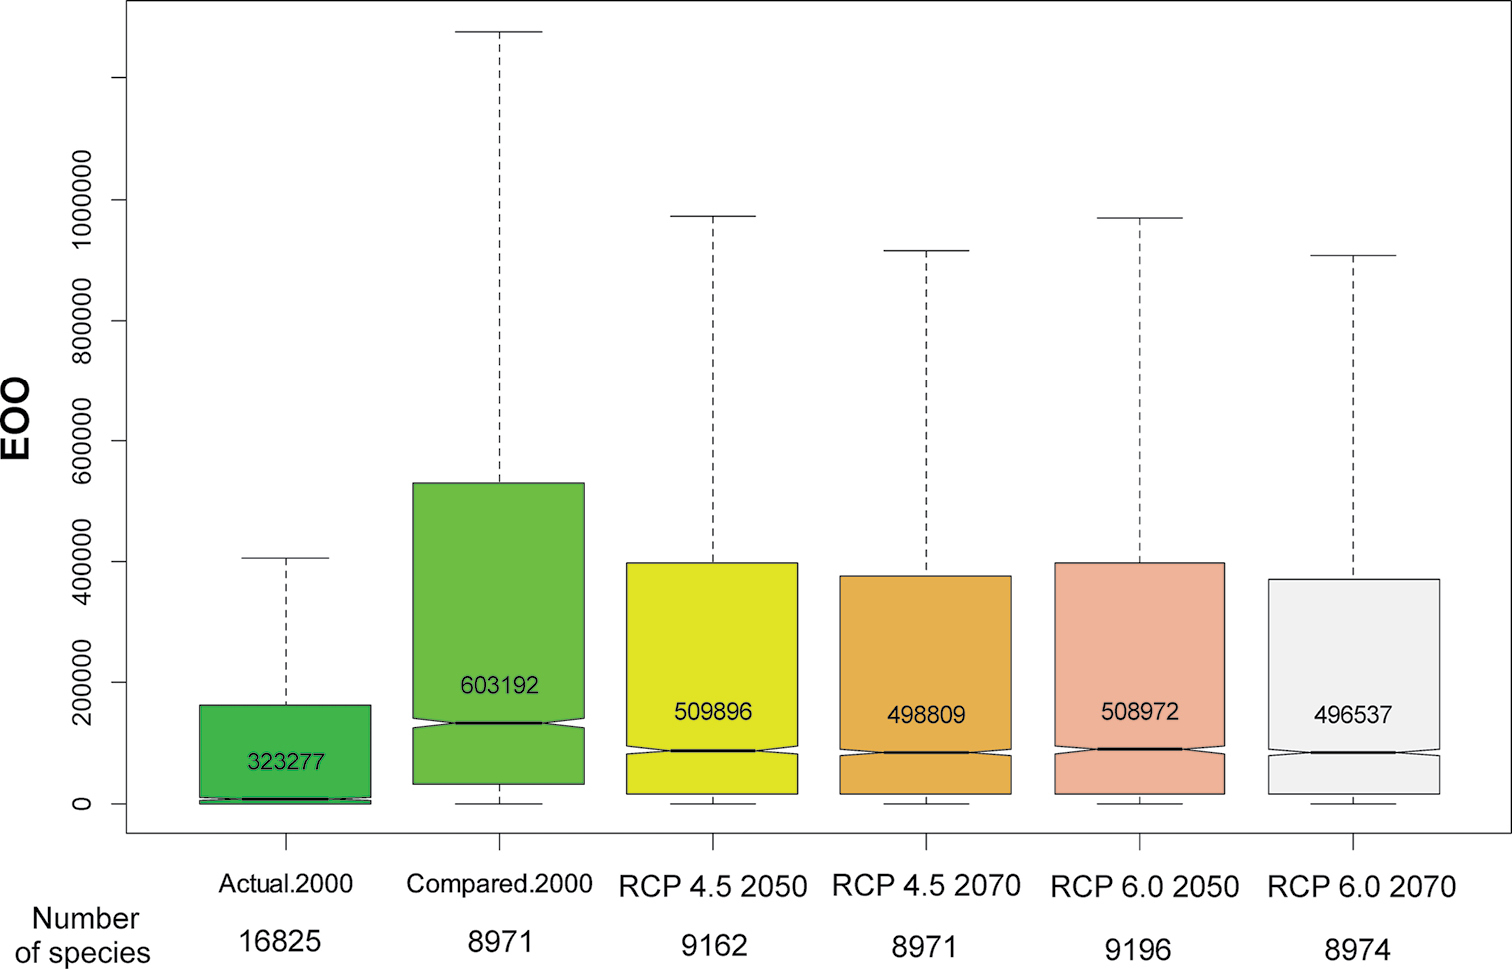
Boxplot showing the extent of occurrence (EOO, in km2) of the species for each scenario and year. The numbers within each plot indicate mean EOO values for all species present in each scenario. The numbers of species predicted as present in each scenario are indicated in the x-axis. The category “Compared.2000” is the mean EOO of the species in the present, but only considering those species predicted as present in the scenario with a higher number of species projected to be extinct (RCP 4.5 2070). Notched box plots show median values (horizontal line), interquartile range values between upper and lower quartiles (top and bottom of the box), distribution of 99% of data (upper and lower dashed lines) and notch lengths representing classic 95% confidence intervals. Note that, when notches do not overlap, medians may be seen to differ significantly (Krzywinski and Altman 2014) and that the difference between “Actual.2000” and “Compared.2000” scenarios is due to the predicted disappearance of species in the future. |