|
||
|
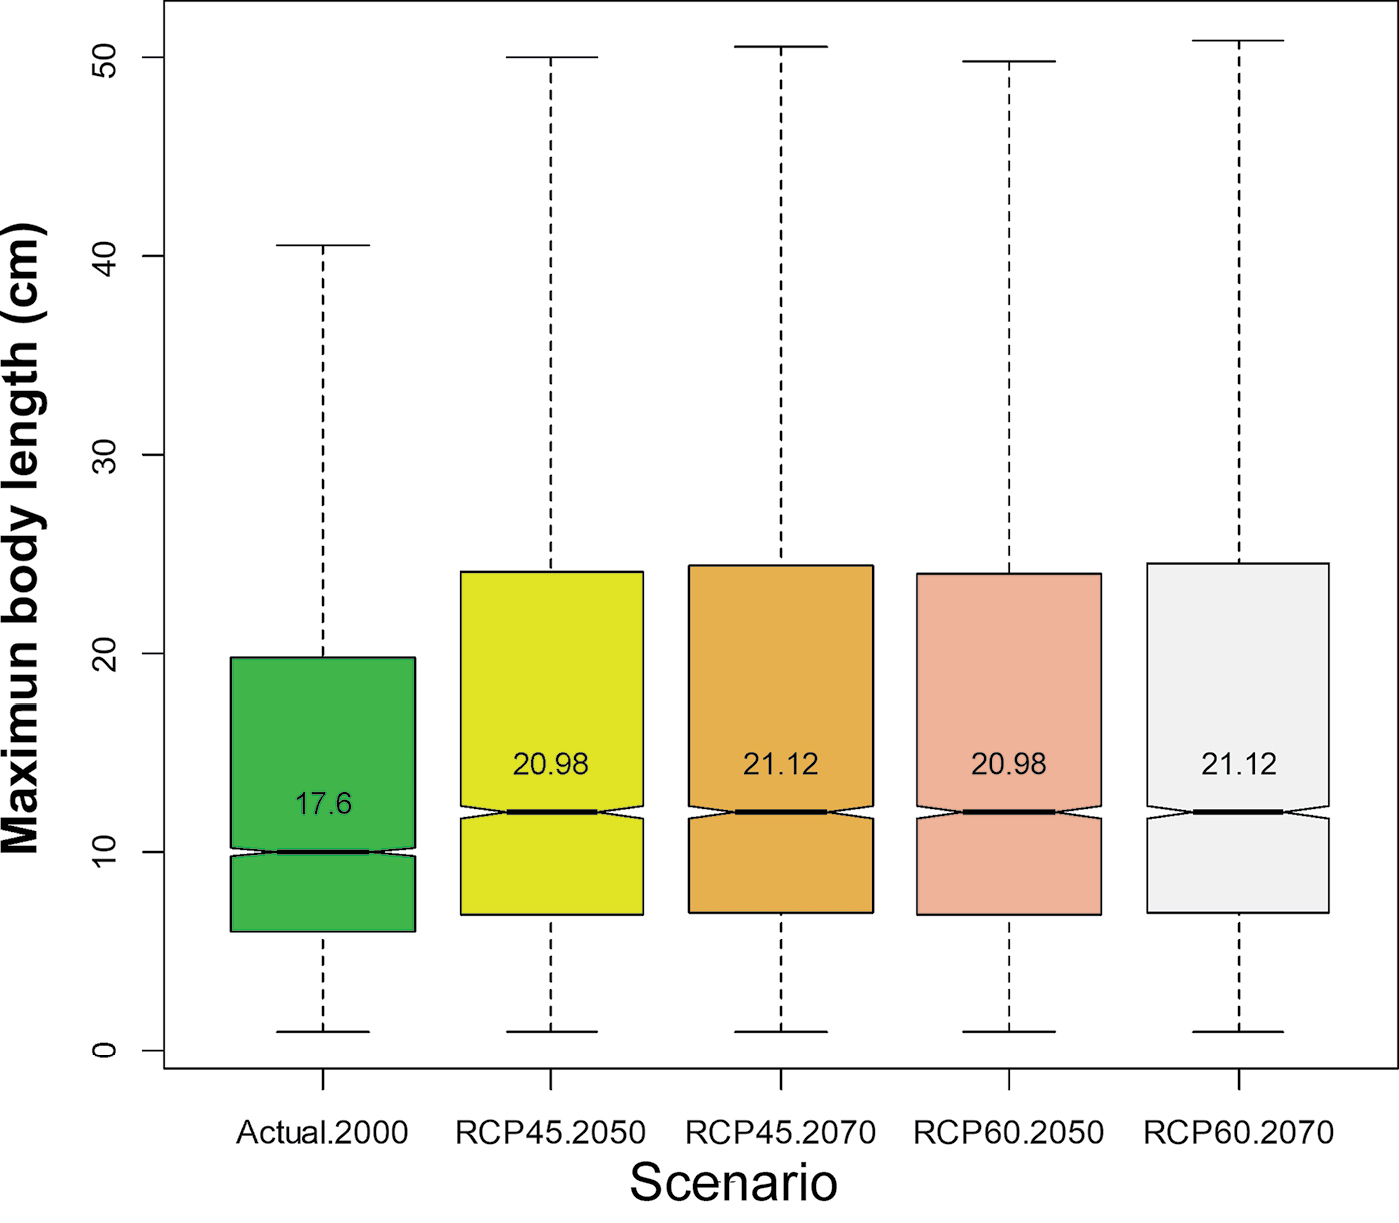
Boxplots with the value of the maximum body length (in cm) of species for each scenario and year. Outliers are not shown in the boxplot. The numbers indicate the mean values for all species present in each scenario. |
|
||||||||
| Part of: Manjarrés-Hernández A, Guisande C, García-Roselló E, Heine J, Pelayo-Villamil P, Pérez-Costas E, González-Vilas L, González-Dacosta J, R. Duque S, Granado-Lorencio C, Lobo JM (2021) Predicting the effects of climate change on future freshwater fish diversity at global scale. Nature Conservation 43: 1-24. https://doi.org/10.3897/natureconservation.43.58997 |