|
||
|
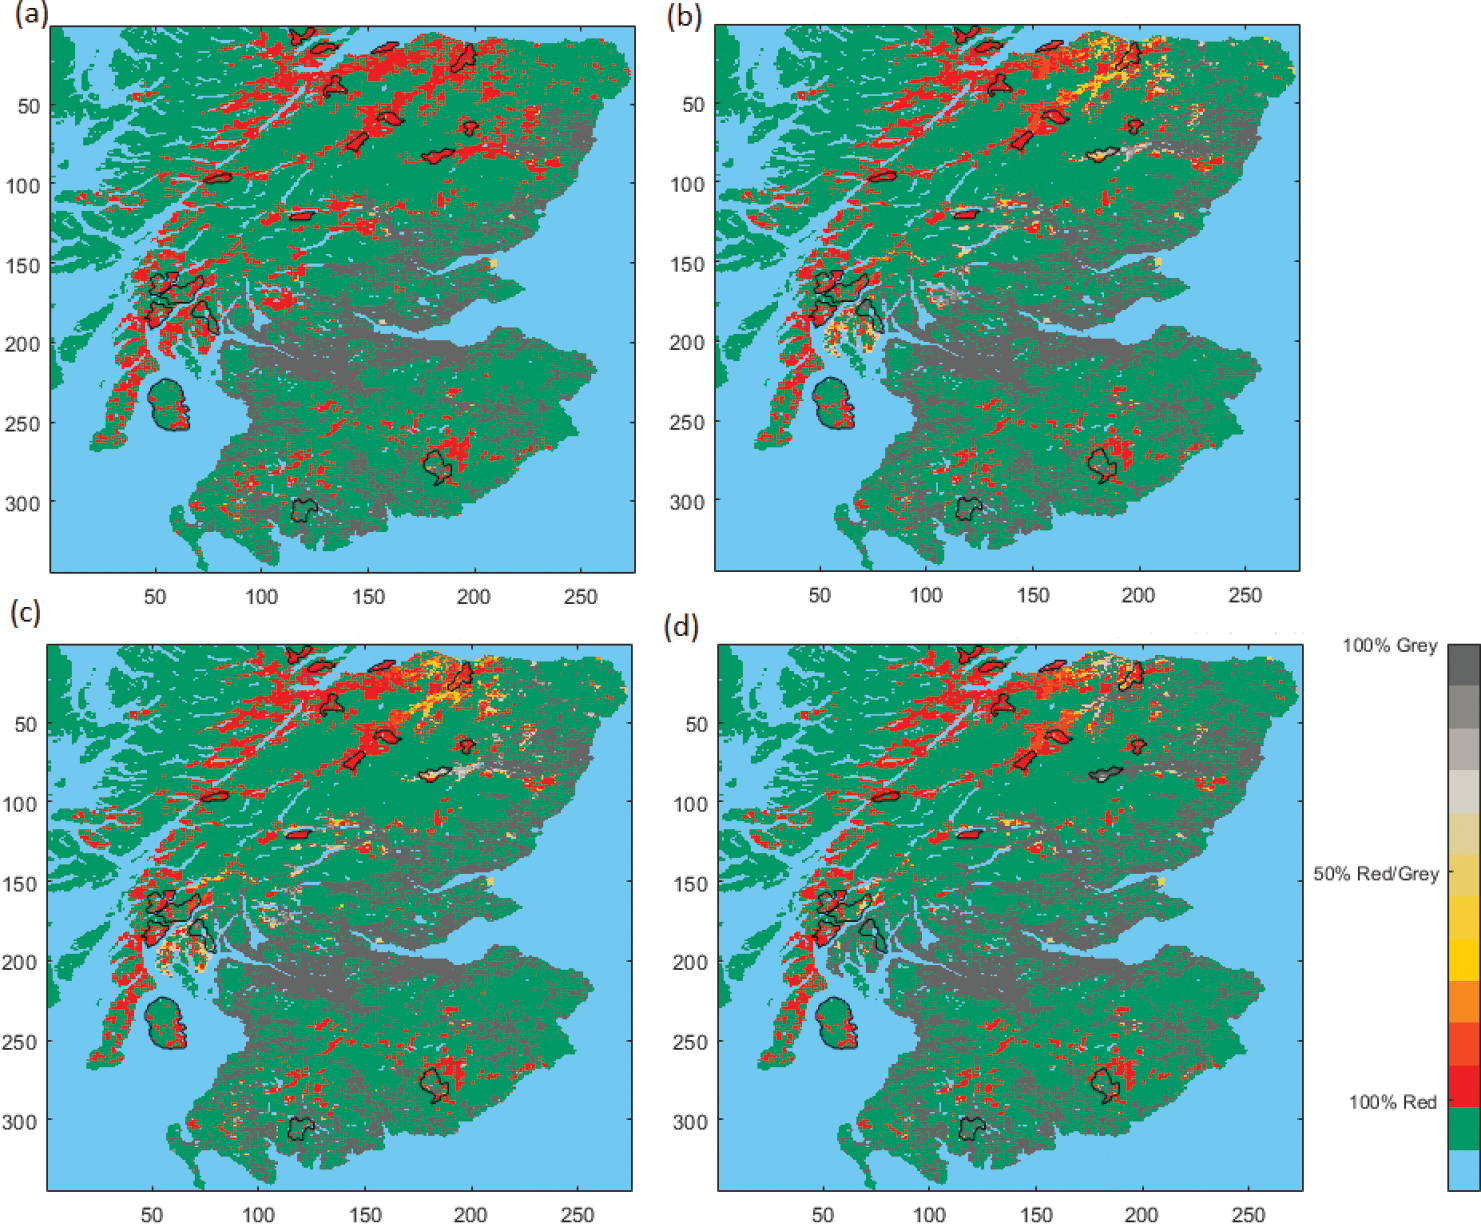
Results showing the relative occupancy of each 1 km grid square. Here (a) shows the initial occupancy, defined using the 10-year model spin-up based on observation data, as maintained by trapping at the grey squirrel control boundary, (b) shows an average occupancy of the first 30 years of the simulation after grey squirrels are allowed to disperse freely, (c) shows the average occupancy results for years 65 to 95 of the simulation where grey squirrels are allowed to disperse freely, and (d) shows the long-term occupancy (150 years after the simulation begins) of red and grey squirrels after greys have been allowed to disperse freely. A grid square is classed as being occupied if there are 2 or more individuals of any species present. The scale bar indicates the proportion of the 10 simulations that ended with either red or grey squirrel occupancy. For example, 70% red occupancy in a given grid square indicates that 7 of the 10 simulations that ended in occupancy were occupied by red squirrels. The 19 designated strongholds (Scottish Forestry 2020) are outlined in black. |