|
||
|
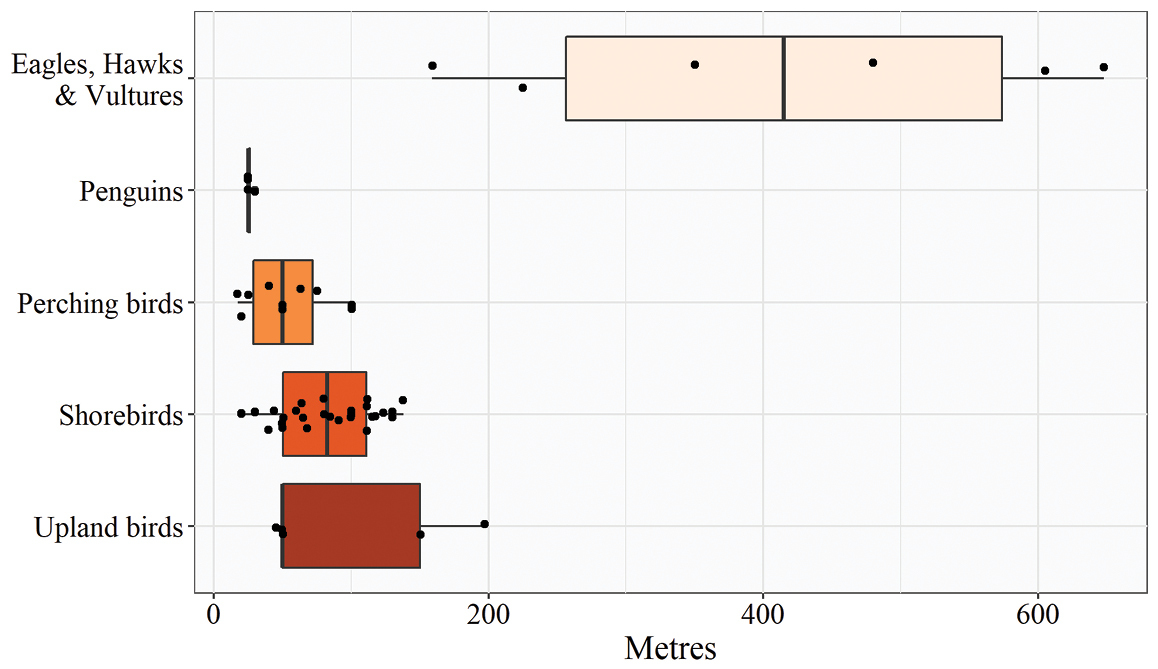
Distance of effect thresholds across bird orders. Threshold distances of birds by taxonomic group. Black dots indicate individual data points. The only owl threshold distance (x = 55 m) is not presented in this figure. Boxplots indicate median and 25th and 75th percentiles. Whiskers extend to data 1.5 times the interquartile range. |