|
||
|
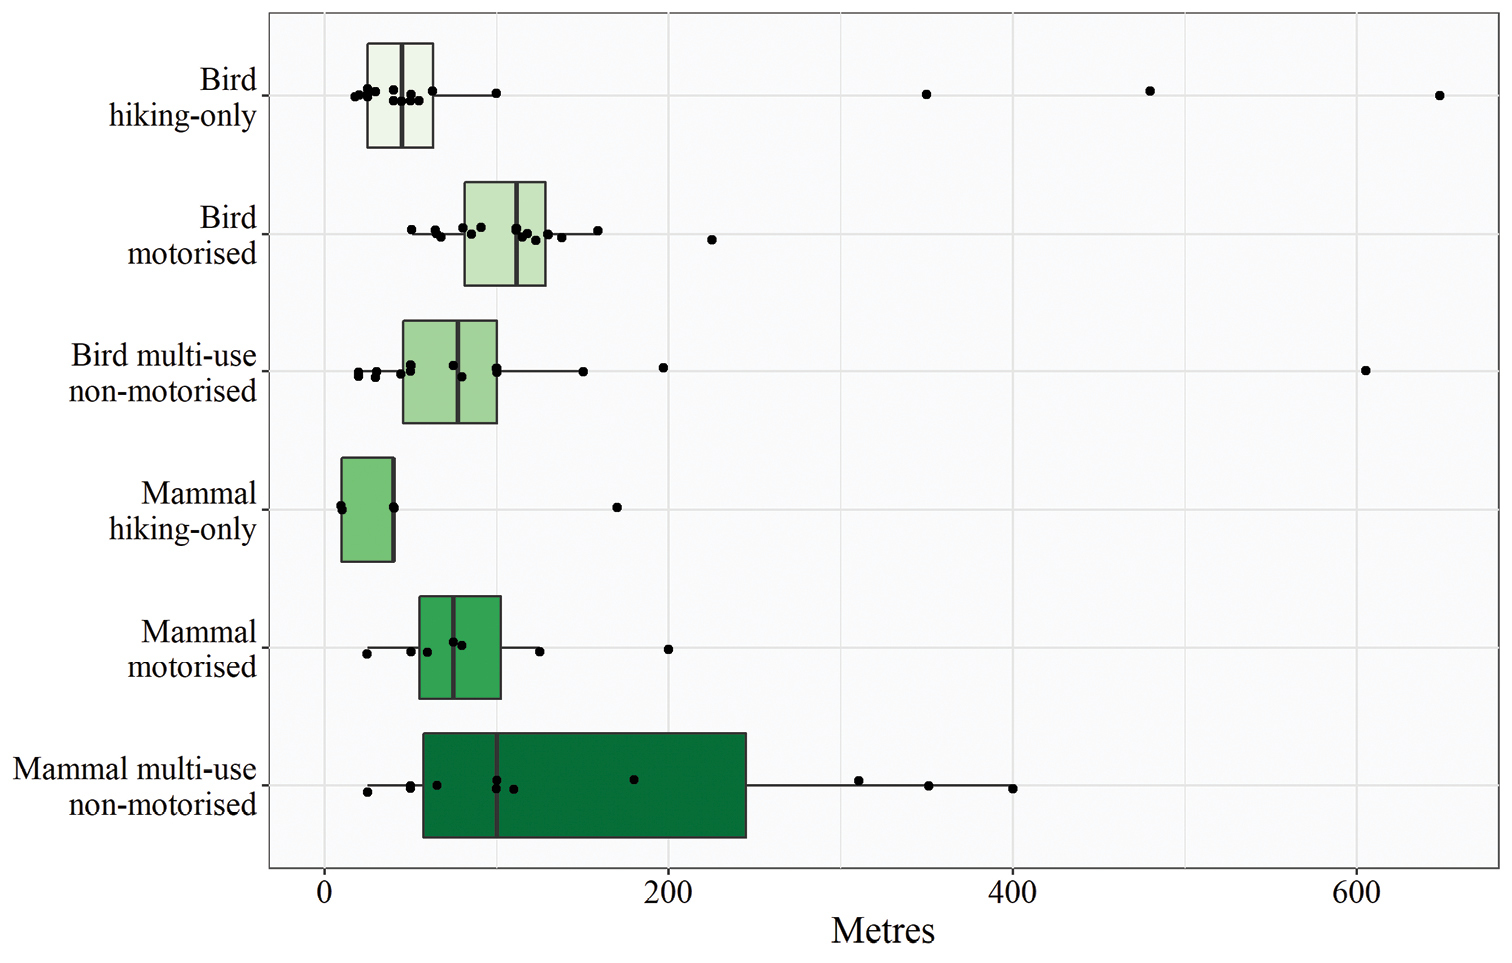
Effect thresholds across groups of recreation activities and taxa. Black dots indicate individual data points. Boxplots indicate median and 25th and 75th percentiles. One outlier of 1000 m is not shown for mammal motorised. Whiskers extend to data 1.5 times the interquartile range. |