|
||
|
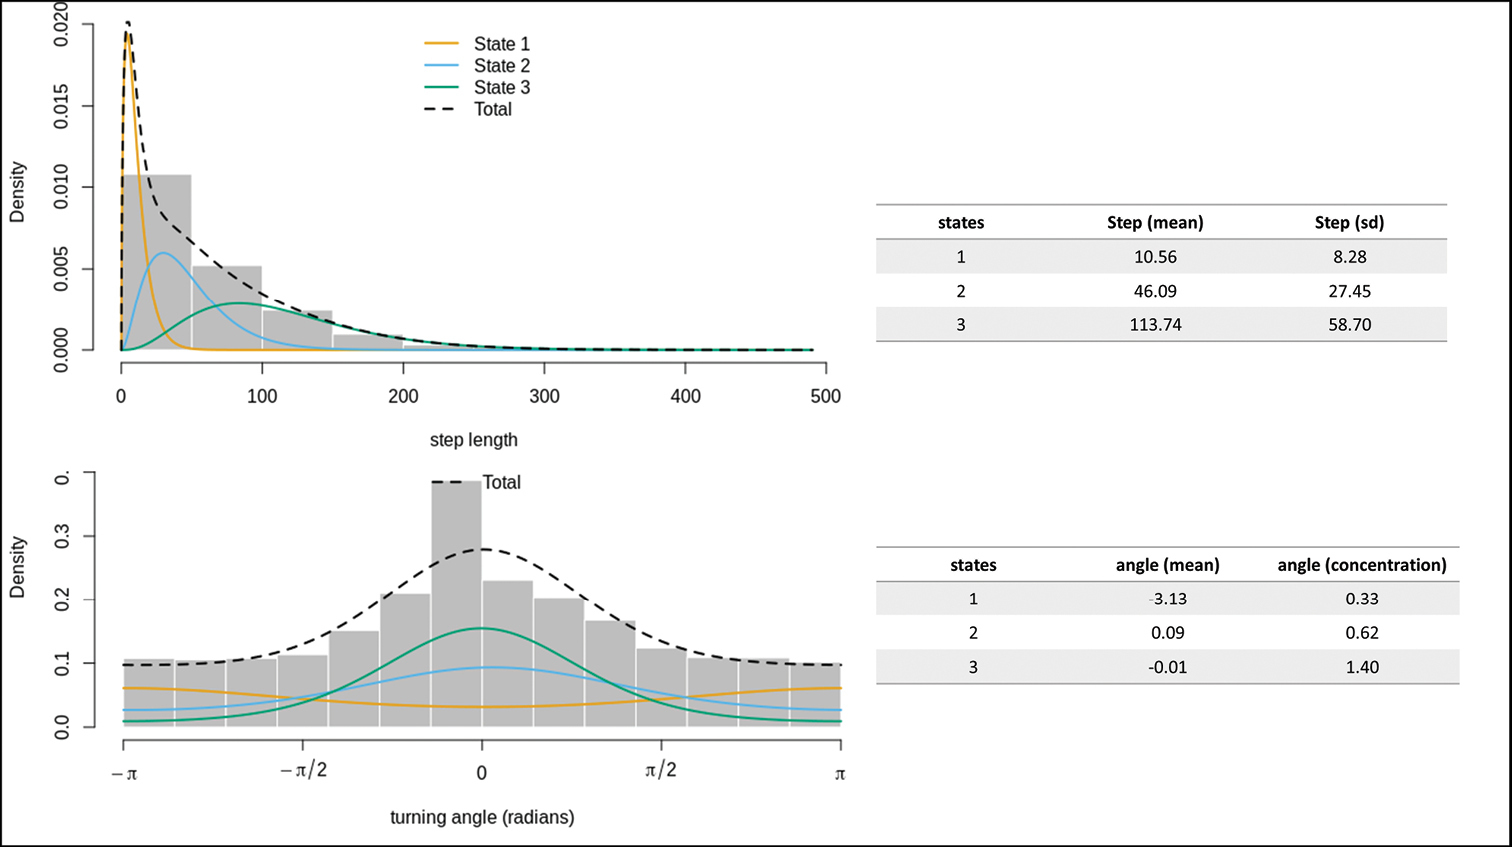
Histograms of observed step lengths (upper plot) and turnings angles (lower plot) with fitted distributions derived from a three-state model for all tracked genets. The coloured lines represent the estimated densities in each state, while the dashed black line is their sum. Tables included in the panels provide estimates of mean step length and standard deviation (sd) and mean turning angle and angle concentration, for observed step lengths (upper table) and turnings angles (lower table). States are: 1 = resting, 2 = foraging, 3 = travelling. |