|
||
|
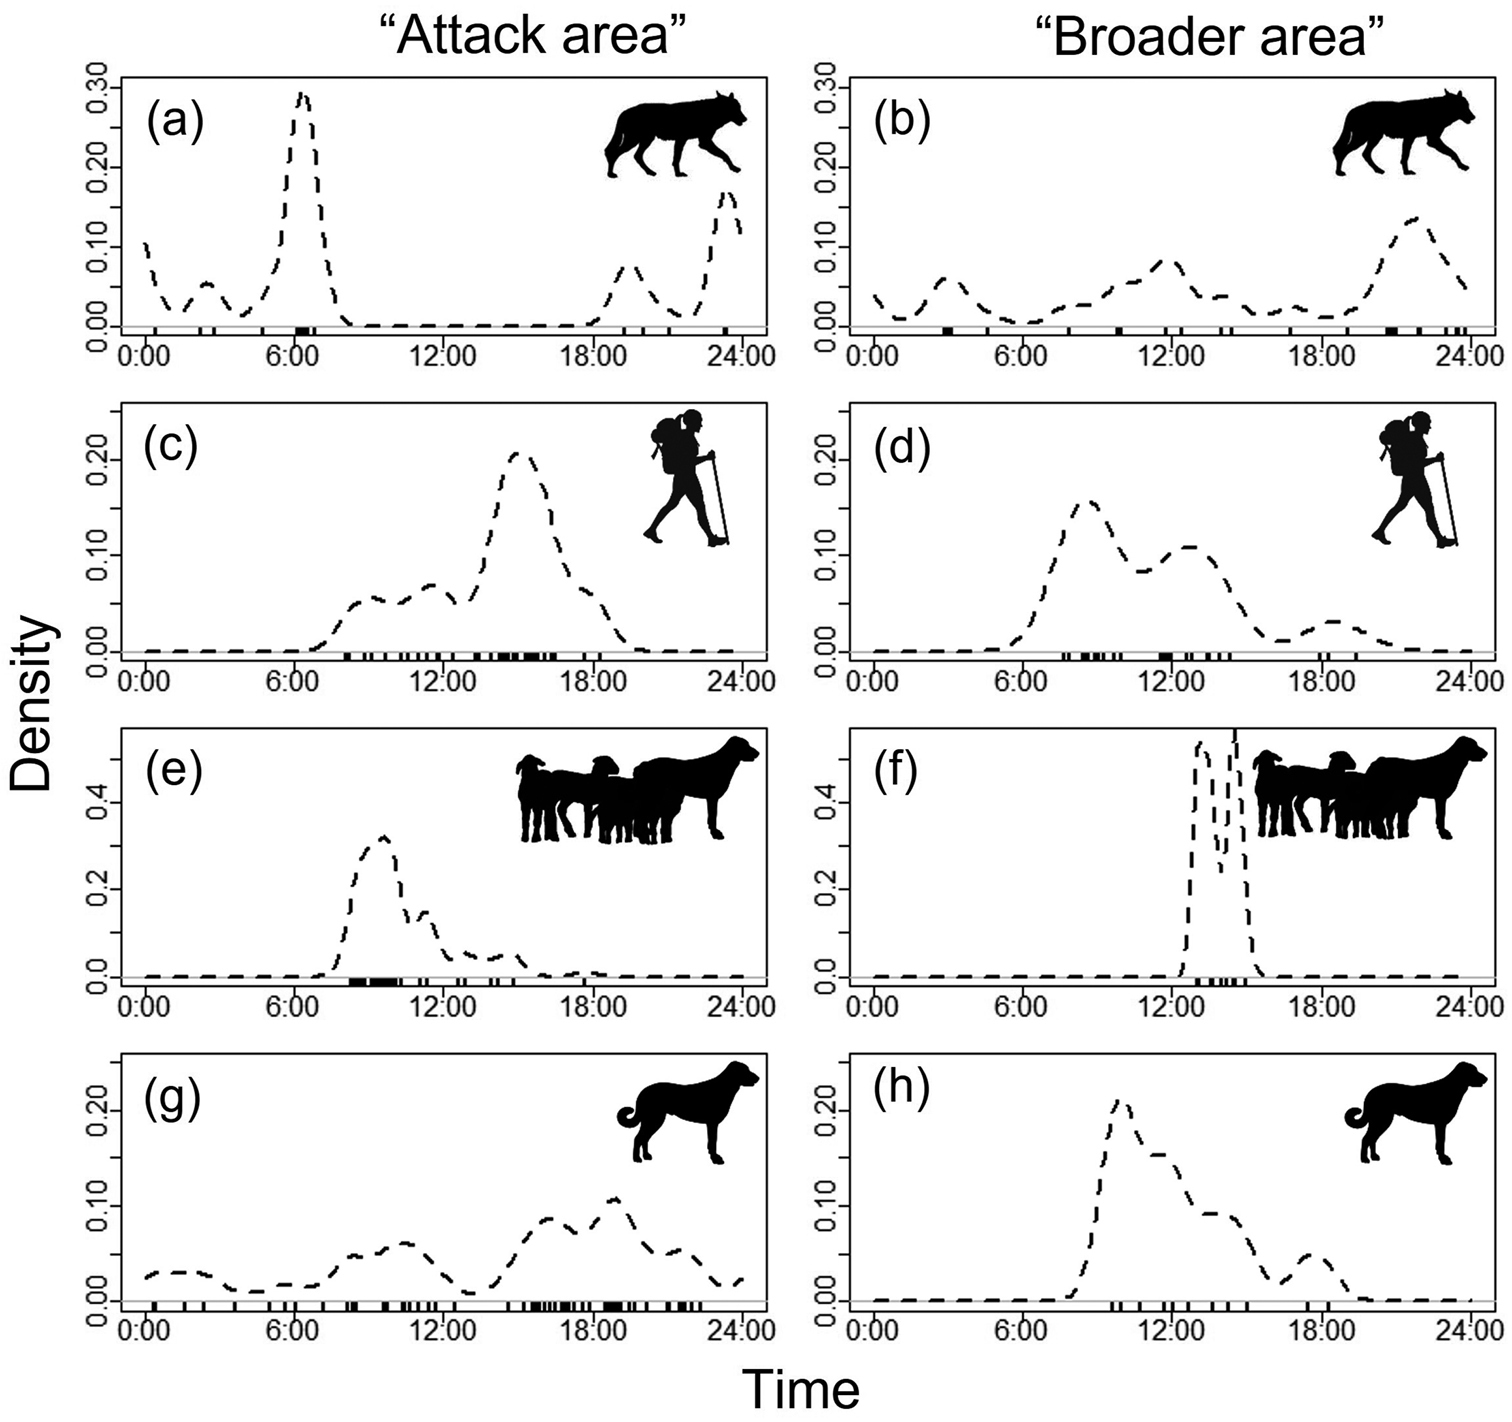
Density plots showing the activity pattern of wolves at (a) “Attack area” (n = 47) and (b) “Broader area” (n = 43), humans (excluding researchers and shepherds) at (c) “Attack area” (n = 49) and (d) “Broader area” (n = 32), supervised large guarding dogs with the herd at (e) “Attack area” (n = 83) and (f) “Broader area” (n = 33) and unsupervised large guarding dogs at (g) “Attack area” (n = 86) and (h) “Broader area” (n = 29). The time of the original observations at the camera traps are displayed as black ticks below the x axes. Sample sizes refer to the sum of all detections (Table 2). |