|
||
|
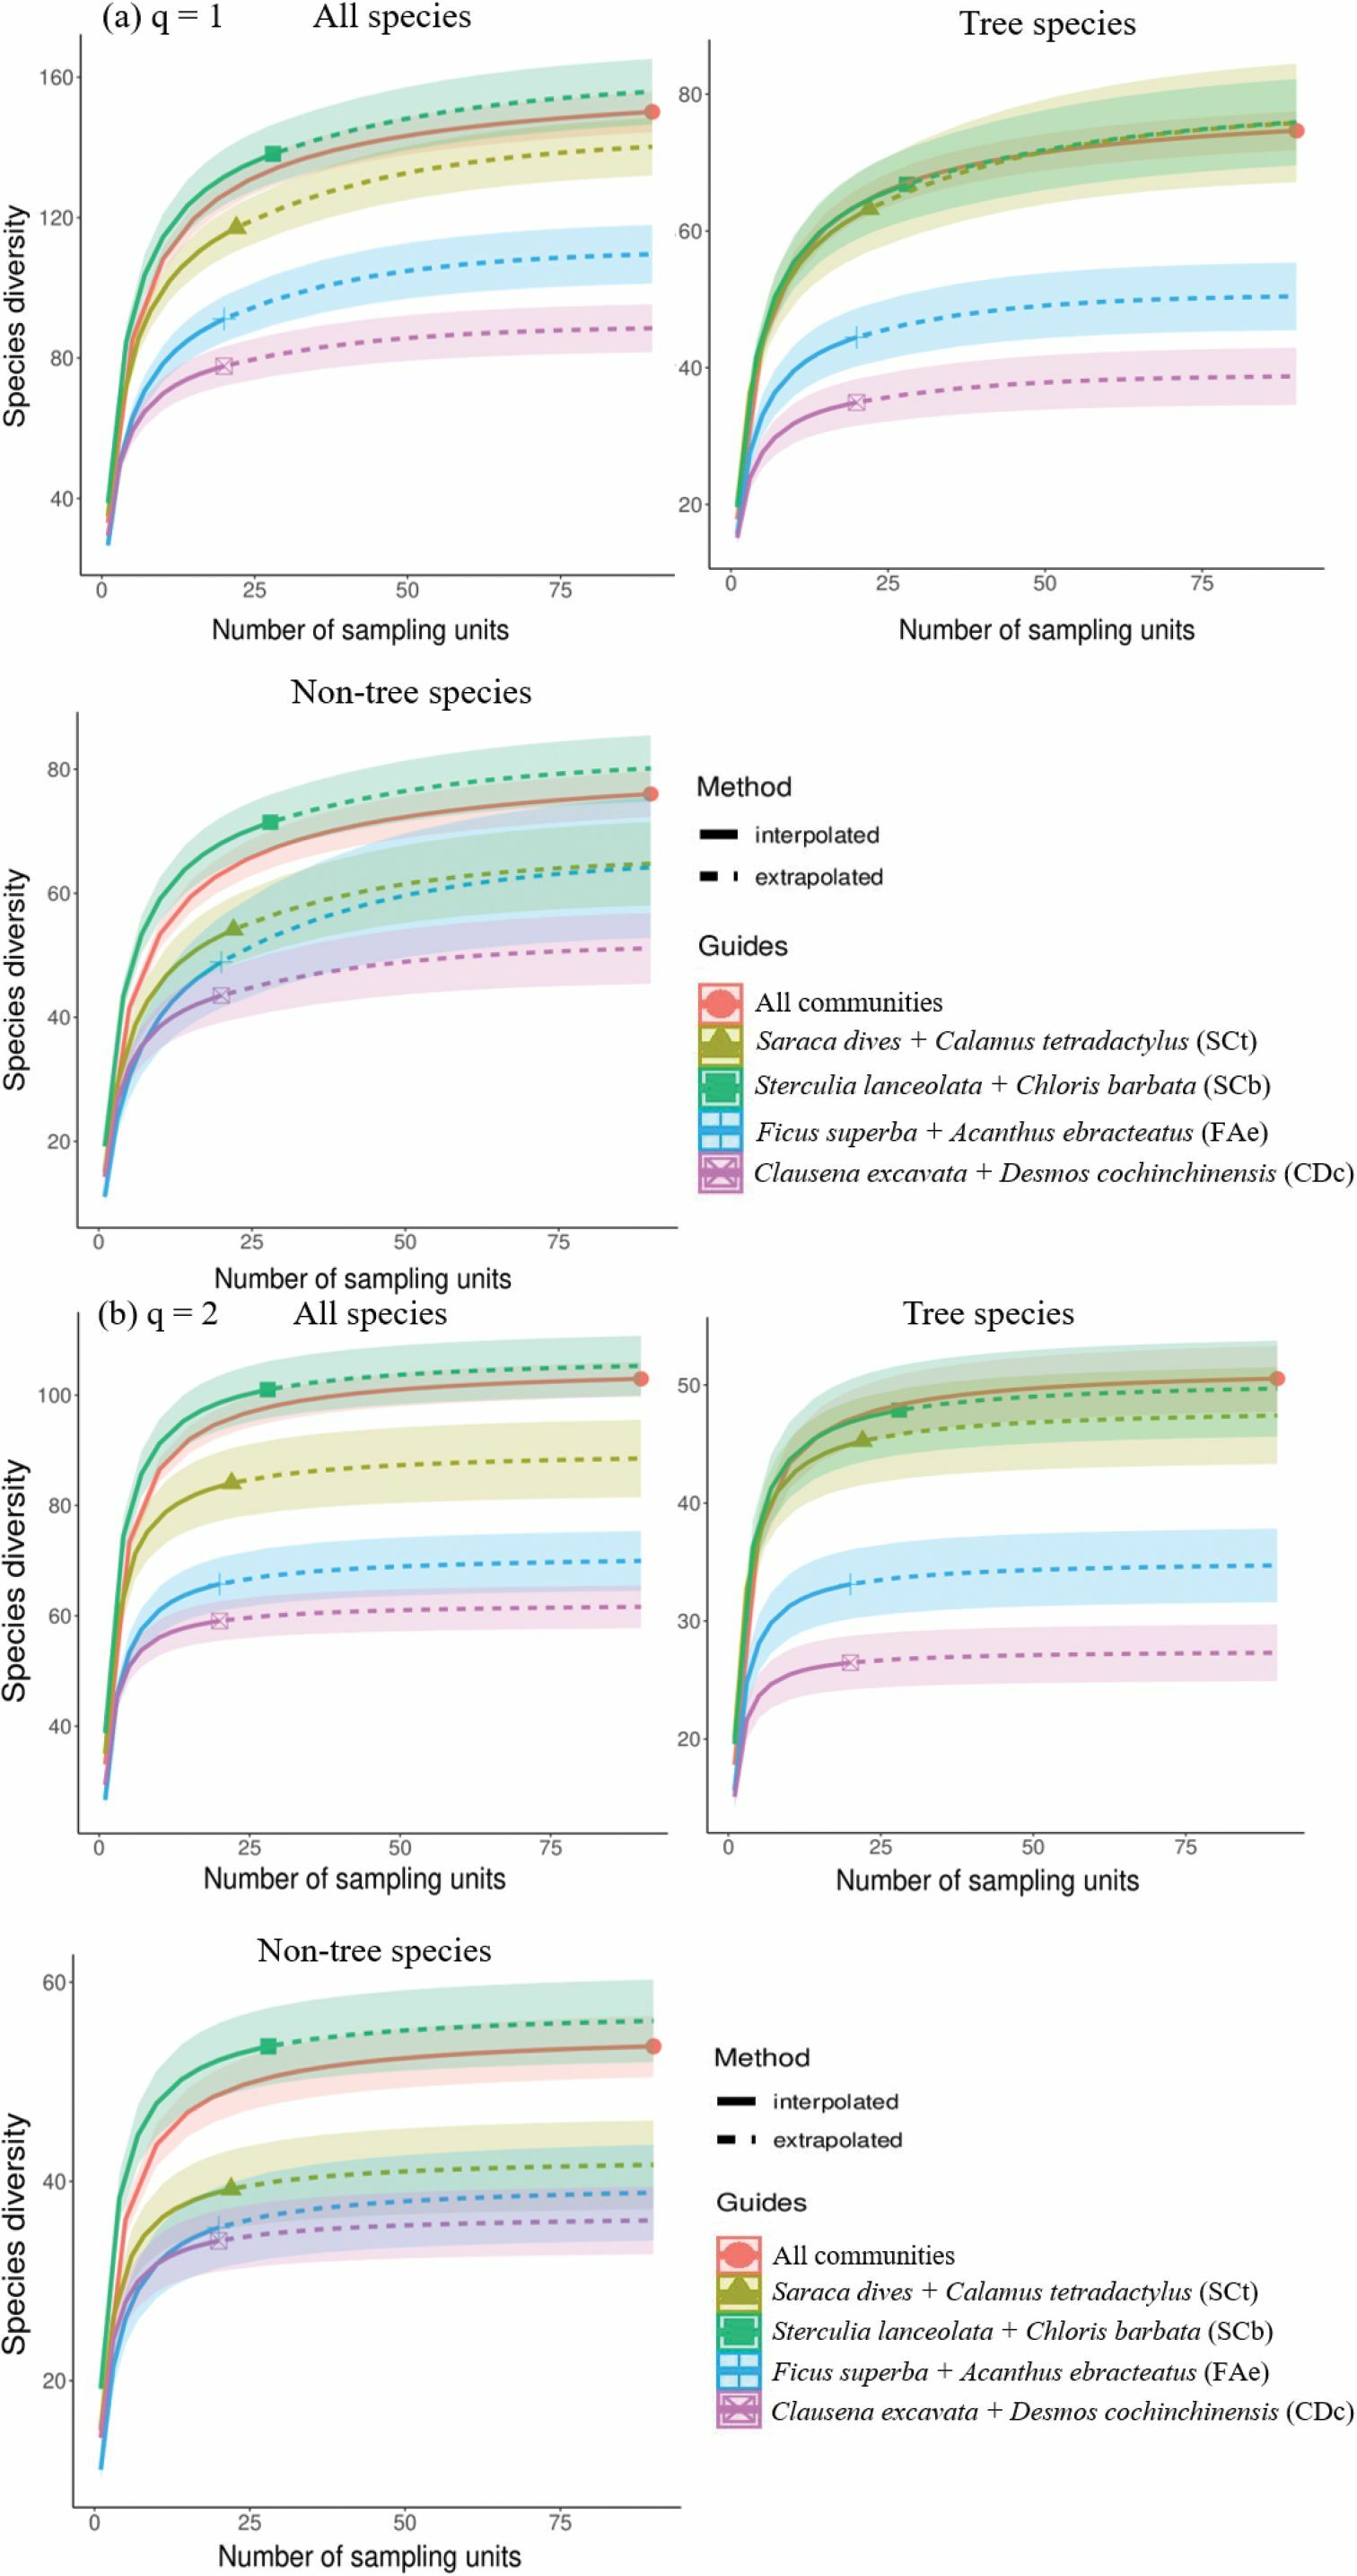
Species diversity patterns of the tree and non-tree species. The graphs show the Shannon (q = 1) and Simpson diversity (q = 2) (Hill number) from iNEXT analysis. The red colour represented the total tree species of all four communities (gamma diversity). Yellow-green colour represented the Saraca dives + Calamus tetradactylus community (SCt). The green colour represented the Sterculia lanceolata + Chloris barbata community (SCb). Light-blue represented Ficus superba + Acanthus ebracteatus community (FAe) and pink colour represented Clausena excavata + Desmos cochinchinensis community (CDc). The fade of the line showed the confidence level at 95%. |