|
||
|
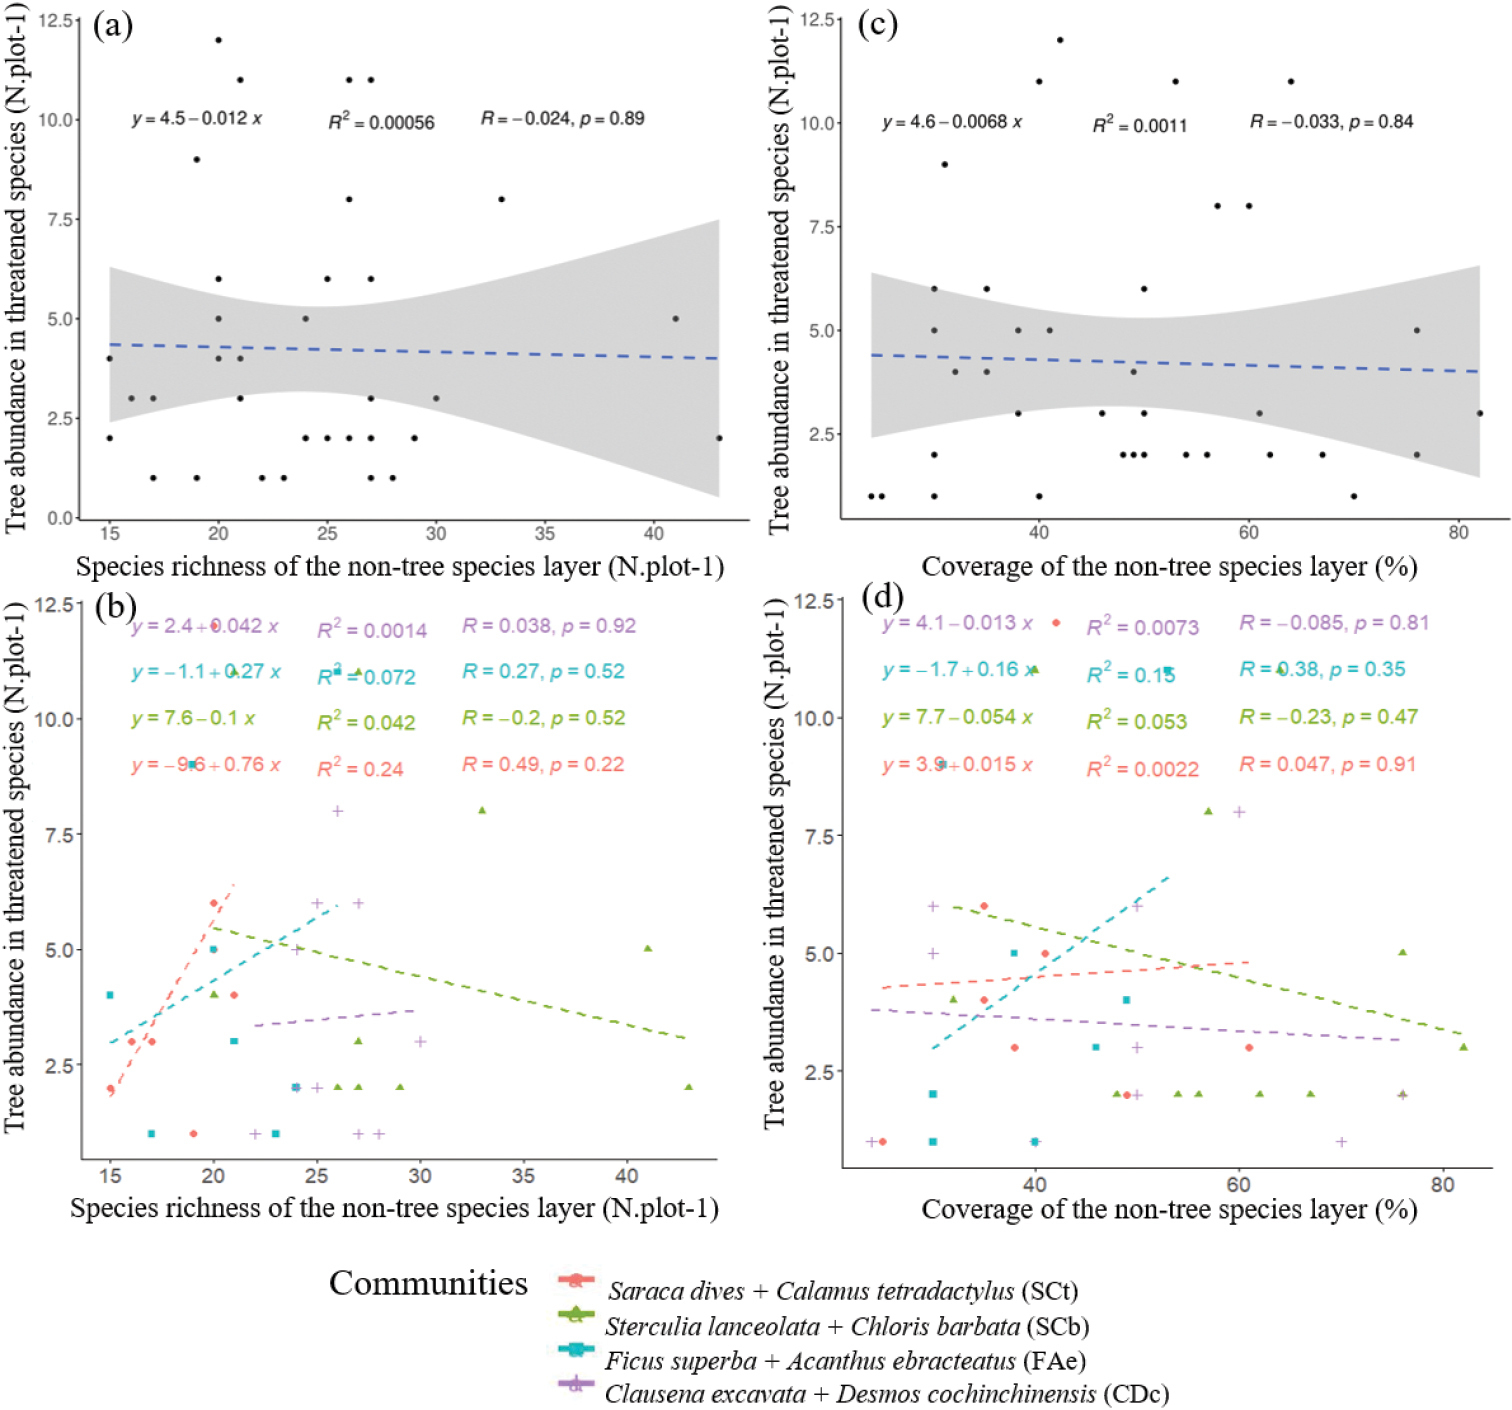
Linear models of non-tree species and threatened tree species abundance. Graphs (a) and (c) show the relationship between non-tree species and threatened tree species abundance across communities. Graphs (b) and (d) present the relationship of non-tree species to threatened tree species abundance separated by the four communities. All relationships are not significant as indicated by the dashed lines. SCt; Saraca dives + Calamus tetradactylus community. SCb; Sterculia lanceolata + Chloris barbata community. FAe; Ficus superba + Acanthus ebracteatus community. CDc; Clausena excavata + Desmos cochinchinensis community. |