|
||
|
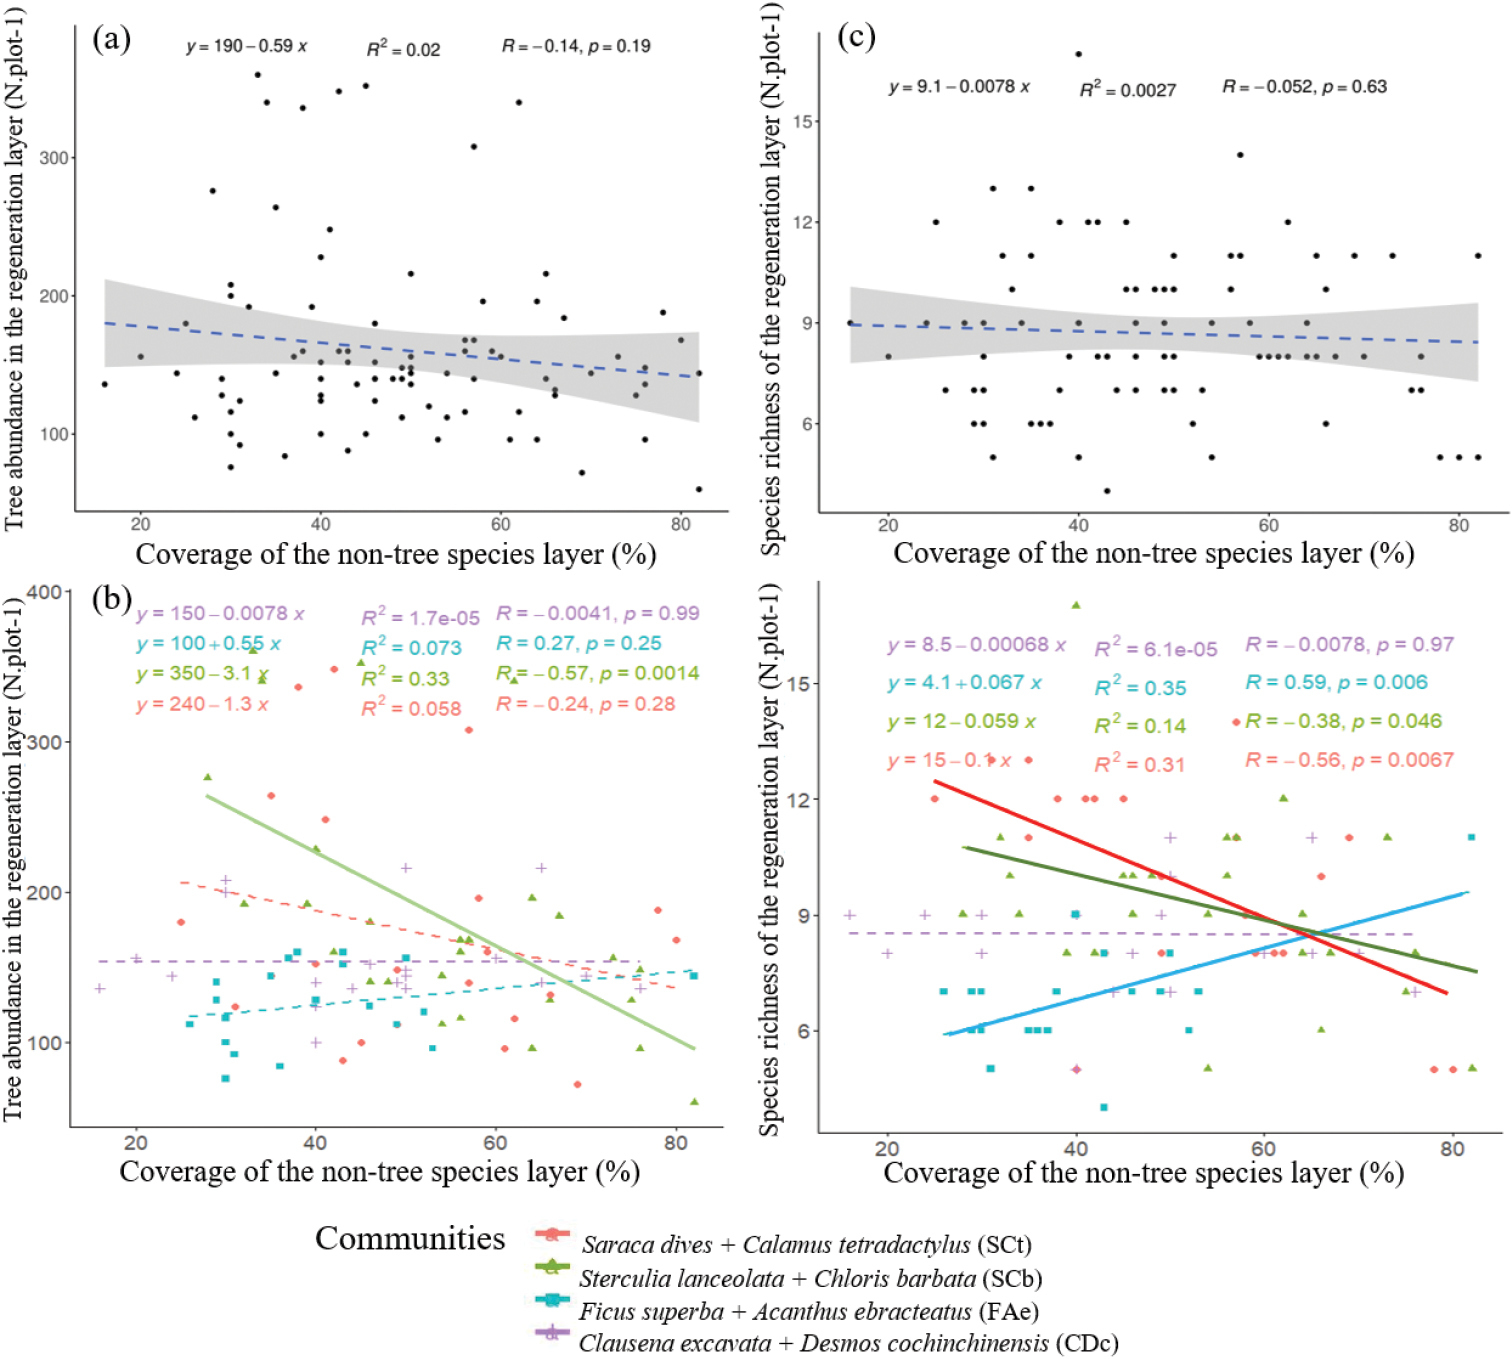
Linear regression models of the coverage of non-tree species and species richness and abundance of the tree regeneration layer. Graphs (a) and (c) show the relationship between the coverage of non-tree species with the abundance and species richness of tree regeneration across all communities, graphs (b) and (d) for the four communities. Dashed lines show statistically non-significant, solid lines show significant correlations. To improve visibility, we did not include the confidence intervals for (b) and (d). |