|
||
|
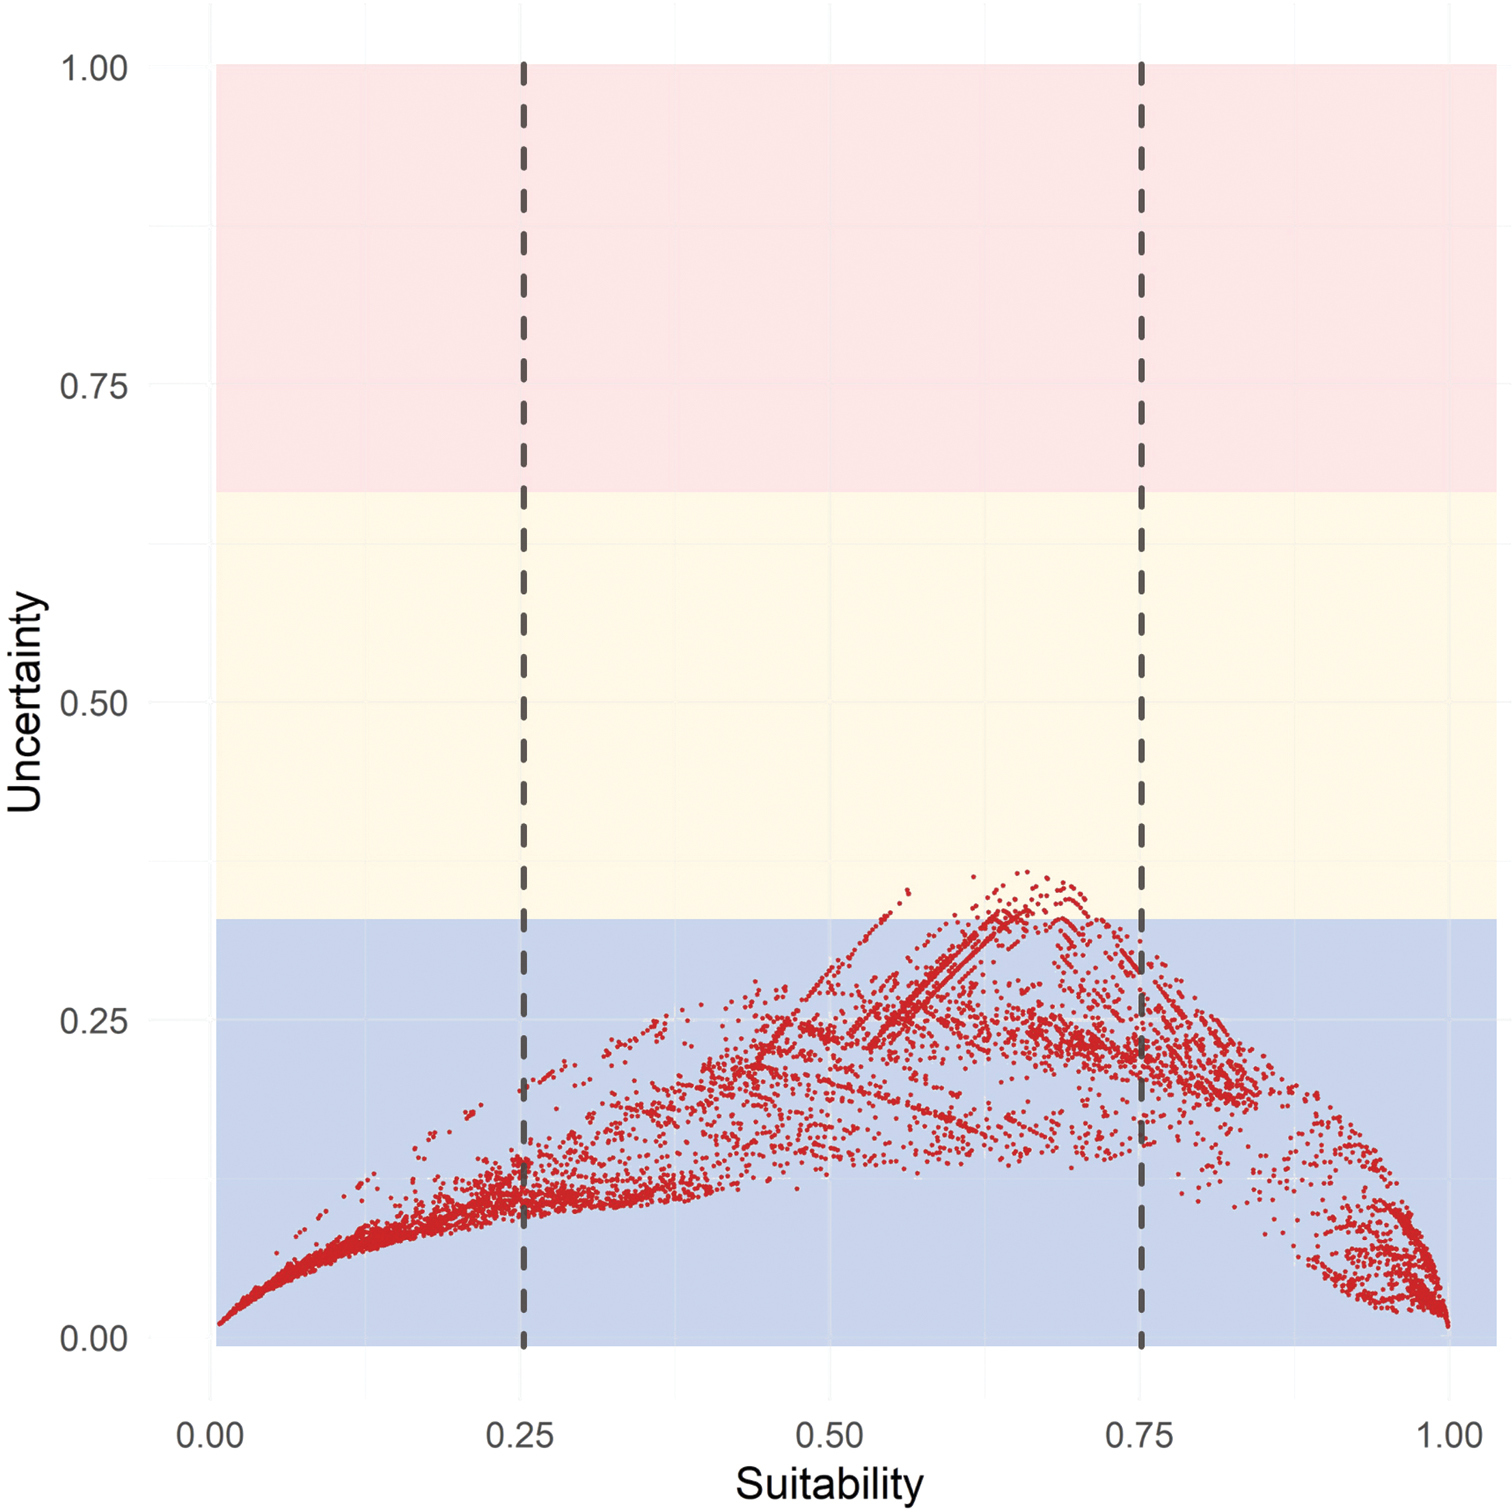
Plots of model uncertainty calculated as range of values observed across 24 replicate analyses in modelling the potential distribution of Bellevalia webbiana under current climate conditions. The values of uncertainty (y axis) were plotted against those of habitat suitability (x axis). Dashed lines delimit key areas for which habitat suitability can be associated with absence or presence with a high degree of confidence. Red, yellow, and blue areas of the scatter plot are associated with high, intermediate or low values of uncertainty. |