|
||
|
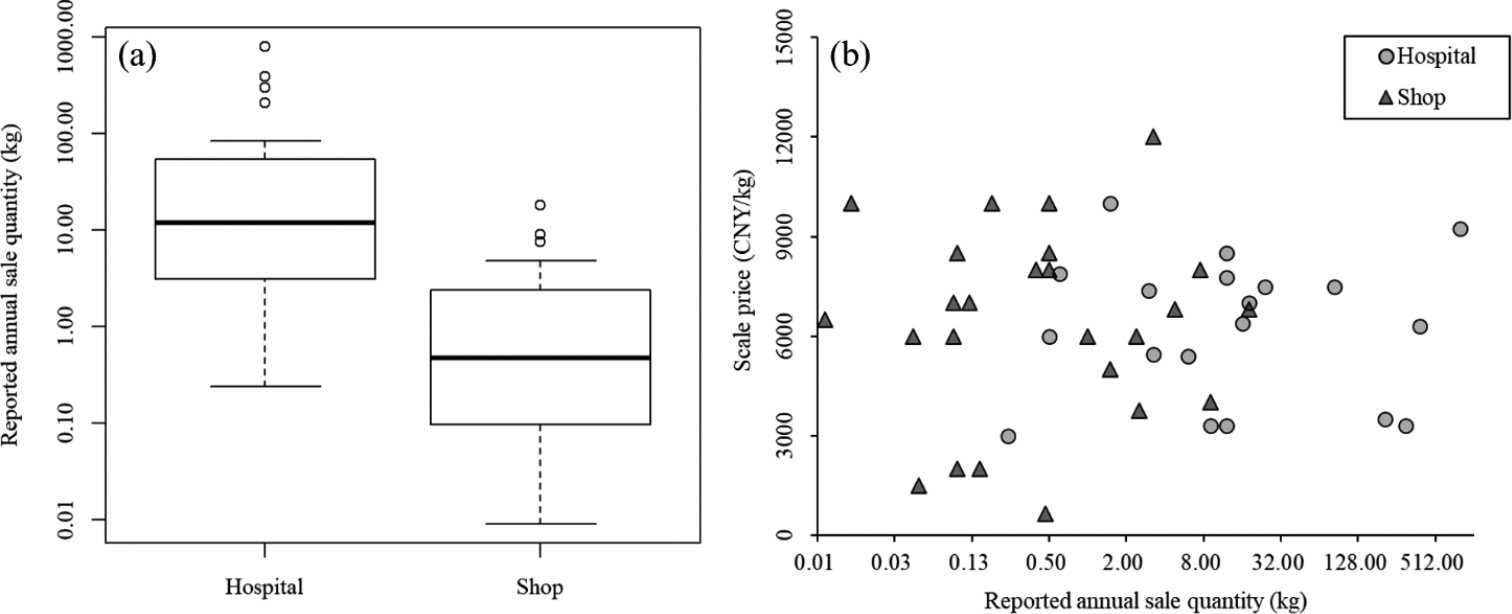
a Box plot showing reported sales quantities in hospitals and shops (N hospital = 20, N shop = 25) b scatter plot showing sale quantities and corresponding prices reported by hospitals (circles) and shops (triangles) (N hospital = 19, N shop = 25). |
|
||||||||
| Part of: Wang Y, Turvey ST, Leader-Williams N (2023) The scale of the problem: understanding the demand for medicinal pangolin products in China. Nature Conservation 52: 47-61. https://doi.org/10.3897/natureconservation.52.95916 |