


(C) 2012 Dirk S. Schmeller. This is an open access article distributed under the terms of the Creative Commons Attribution License 3.0 (CC-BY), which permits unrestricted use, distribution, and reproduction in any medium, provided the original author and source are credited.
For reference, use of the paginated PDF or printed version of this article is recommended.
Biodiversity monitoring is central to conservation biology, allowing the evaluation of the conservation status of species or the assessment of mechanisms of biodiversity change. Birds are the first taxonomic group to be used to build headline indicators of biodiversity due to their worldwide spatial and temporal coverage and their popularity. However, the landscape of bird-monitoring practices has never been characterized quantitatively. To objectively explore the strengths and weaknesses of the massive bird-monitoring effort in Europe we assessed the bird-monitoring practices, acquired with a questionnaire-based survey, in a sample of monitoring programs. We identify major correlates of among-program variability and compare monitoring practices from our database to recommendations of best monitoring practices. In total, we obtained responses from 144 bird-monitoring programs. We distinguish three types of monitoring programs according to the number of people that they involve: small, local-scale programs (56%), medium or regional programs (19%), and large-scale, national and international, programs (23%). In total, the programs in our sample involved 27941 persons, investing 79298 person days per year. Our survey illustrated that 65% of programs collected quantitative indices of abundance (count data). The monitoring design in a majority of the programs could be improved, notably in terms of unbiased spatial coverage, sampling effort optimization, replicated sampling to account for variations in detection probability, and more efficient statistical use of the data. We discuss the main avenues for improvement in bird-monitoring practices that emerge from this comparison of current practices and published methodological recommendations.
conservation priorities, biodiversity monitoring, volunteers, survey design, conservation status in Europe, conservation policy support
Biodiversity and environmental monitoring provide fundamental information for tracking environmental changes, to diagnose population trajectories and to provide conservation biology with relevant data. Such information is required for the design and evaluation of biodiversity policies, conservation management, land use decisions, and environmental protection. Biodiversity monitoring is therefore central to conservation biology, allowing the evaluation of the conservation status of species or to assess biological responses to environmental changes (such as climate change,
A large number of monitoring programs have been developed and a large body of literature on biodiversity monitoring is available, including several articles that provide recommendations for an optimal design of monitoring programs (
Bird-monitoring initiatives are the first provider of long-term monitoring data when institutional bodies set the goals of quantifying global biodiversity changes and of assessing the impact of environmental policies on biodiversity (
For the first time, a comprehensive database of the FP6-project EUMON (hereafter DaEuMon;
600 monitoring programs are available in DaEuMon database; They were obtained through a questionnaire survey (ESM1). Among them, 144 concern bird species and were analyzed in detail. We checked responses for completeness, and sought missing details from the coordinators of monitoring projects. Once the responses have been validated, data were made publicly available through our online database (http://eumon.ckff.si/biomat/ ). Complete information was not available for every single question for all programs, hence affecting sample sizes in the analyses.
For the characterization of the bird-monitoring landscape, we focused on differences in the motivation and aims, sampling design, sampling effort and methods used for data analysis. We analyzed the differences between bird species groups (raptors, songbirds and near passerines, waterbirds) and between monitoring programs of different sizes in terms of the number of persons involved. We defined three size-categories: small (Npersons ≤ 30; N = 81), medium (Npersons 31 – 150; N = 26) and large monitoring programs (Npersons > 150; N = 32). The motivation was characterized by the program objective (scientific, management or political/juridical), the type of trends monitored (distribution, population size or avian community trends) and the focal ecological factor (climate change, habitat fragmentation, pollution, invasive species, land use). Sampling design was characterized by site choice methodology, the use of stratified sampling or not, the use of repeated sampling or not (that allow accounting for detection probability), the location of sampling sites within and/or outside protected areas, and the main field data type collected (Presence/absence, Counts, Mark recapture, Age/size structure, Phenology). We further quantified the sampling effort by the number of species (Nspecies), persons (Npersons), sites (Nsites), visits per site (Nvisits), sampling effort in person.days, and the proportion of volunteers (%Vol).
We tested for differences in practices with generalized linear models (GLM) using SAS 9.1.3 (Cary, USA, 2002); GLM with a multinomial distribution of error terms and a clogit link function for the type of field data (categorical variable); GLM with a Poisson distribution of error terms and a log link function for the number of species monitored; GLM with a binomial distribution of error terms and a logit link function for the analysis of the use of stratification, of detection probability, and of advanced statistics. The dependent variables were therefore: the type of field data, the number of species monitored, the use of stratification, the use of detection probability, and the use of advanced statistics. The corresponding independent variables included in the models were: the number of persons involved in the program, the number of professionals, the ratio of volunteers, the number of person days, and the program objective. We also included the sampling design used when analyzing the use of advanced statistics. The models were adjusted for overdispersion when necessary. We conducted a stepwise procedure with a backward elimination at the 5%-level, starting with a fully saturated model, incorporating all independent variables with no interaction, and dropping, step-by-step, all non-significant variables. At each step, the term that gave the smallest contribution to the model (largest p-value) was excluded.
Bias in geographic coverageA major problem of surveys such as ours (volunteer response to a mailed questionnaire) is that it is nearly impossible to achieve a random sample because of the decentralized structure of the network of monitoring activities (
Despite a large effort in sending out requests for cooperation to a wide audience, our survey data provide a characterization of monitoring practices in Europe that suffers from a biased geographic coverage. We used GoogleScholar to estimate the bias in our sample by looking for articles with the search string (“bird-monitoring” OR “bird survey” country). Our analysis shows that Lithuania, Poland, France, Bulgaria and Andorra were overrepresented in our program, while Great Britain, for example, was underrepresented (Figure 1). Also in comparison to data collected by EBCC, our survey has obviously undersampled bird-monitoring programs in Great Britain and Sweden. Our survey covers 24 European countries, with a strong (over-) representation of France and Poland (Figure 1;
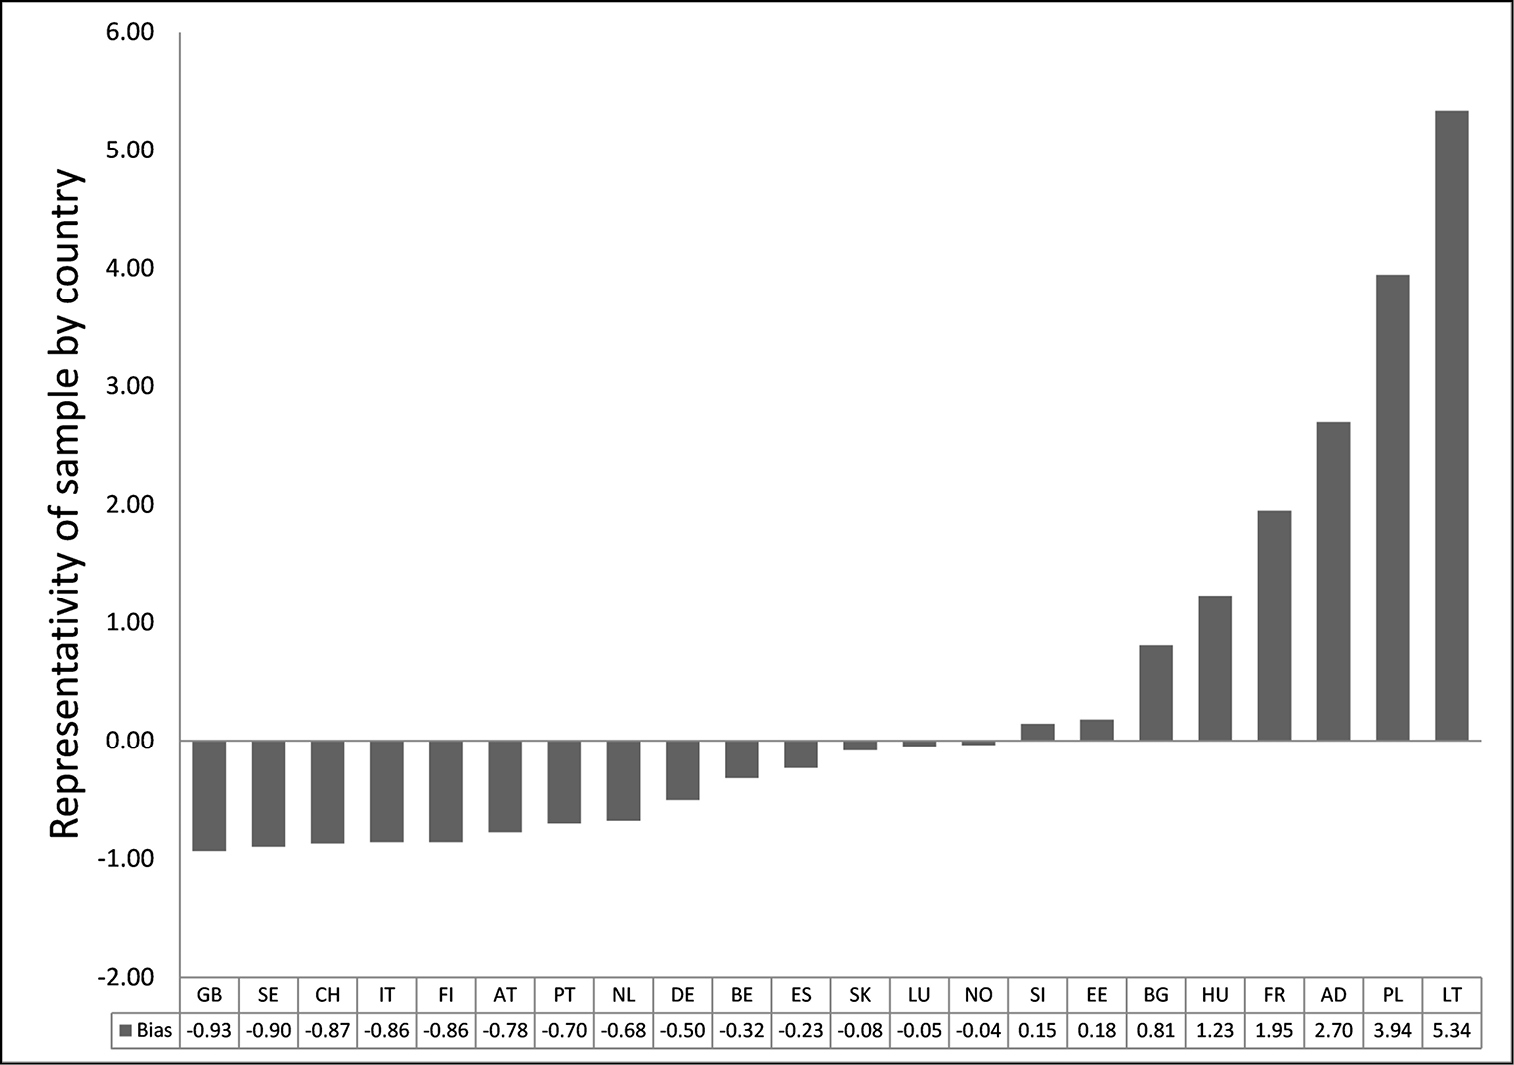
Estimation of the bias in the number of bird-monitoring programs in the EuMon database per country (bias = [Number of programs DaEuMon – Number of articles in Google Scholar]/ Number of articles in Google Scholar). The reference to quantify bird monitoring activity per country was the number of publications in GoogleScholar returned for the search string (“bird-monitoring” OR “bird survey” AND country name). The countries are abbreviated following the two-letter convention of the international community (ISO 3166-1 alpha-2 codes; GB = Great Britain, SE = Sweden, CH = Switzerland, IT = Italy, FI = Finland, AT = Austria, PT = Portugal, NL = Netherlands, DE = Germany, BE = Belgium, ES = Spain, SK = Slovakia, LU = Luxembourg, NO = Norway, SI = Slovenia, EE = Estonia, BG = Bulgaria, HU = Hungary, FR = France, AD = Andorra, PL = Poland, LT = Lithuania).
Our European-wide survey yielded responses from 144 bird-monitoring programs employing 27941 persons investing 79298 person days per year. The majority of responses recorded in our database came from France (49; 34%) Poland (28; 19%), and Lithuania (13; 9%). Six to eight responses came from the Netherlands, Germany, Spain, Norway, and Hungary (35; 24%; Figure 2). In total, all bird-monitoring programs employed 27941 persons, with a mean of 201+/- 75 persons per program and a mean manpower of 615 +/- 138 person days per year per program.
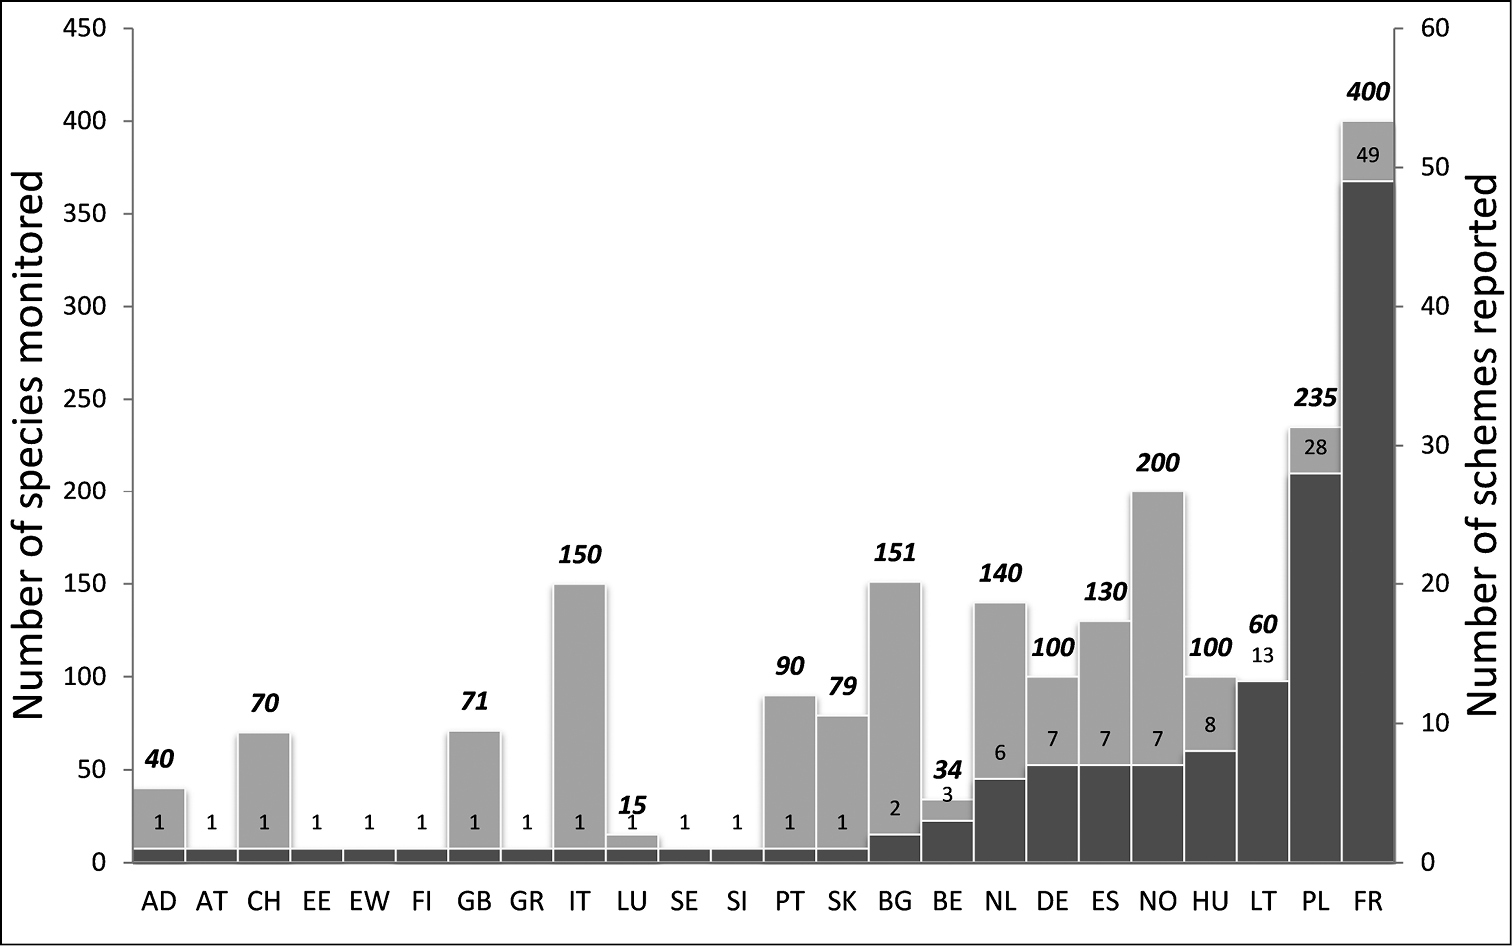
Number of responses (dark grey) and number of species monitored (light grey) per country. The countries are abbreviated following the two-letter convention of the international community (ISO 3166-1 alpha-2 codes). (AD = Andorra, AT = Austria, CH = Switzerland, EE/EW = Estonia, FI = Finland, GB = Great Britain, GR = Greece, IT = Italy, LU = Luxembourg, SE = Sweden, SI = Slovenia, PT = Portugal, SK = Slovakia, BG = Bulgaria, BE = Belgium, NL = Netherlands, DE = Germany, ES = Spain, NO = Norway, HU = Hungary, LT = Lithuania, PL = Poland, FR = France). Bold italic values correspond to the number of species.
Small programs monitored 29 +/- 5.2 species (median = 6) with 11 +/- 1 persons (median = 7), which were mainly professionals (66% +/- 4.5), investing on average 148 +/- 34.2 days per year, visiting 116 +/- 67.7 sites (median = 12) on average 9.4+/-2.9 times (median = 3). Medium sized programs monitored 42 +/- 17.8 species (median = 5) with 64 +/- 4.7 persons (median = 60), which most frequently were volunteers (77% +/- 5.7), investing on average 492 +/- 109 days per year, visiting 67 +/- 16.9 sites (median = 43) on average 28.7+/-19.1 times (median = 9.5). Large programs monitored 72 +/- 12.2 species (median = 70.5) with 793 +/- 306 persons, of which most are volunteers (82.3% +/- 5.8), investing on average 1939.6 +/- 534.6 days per year, visiting 1098.7 +/- 357.1 sites (median = 560) on average 7.3+/-3.7 times (median = 2; see Figure 3 for more details).
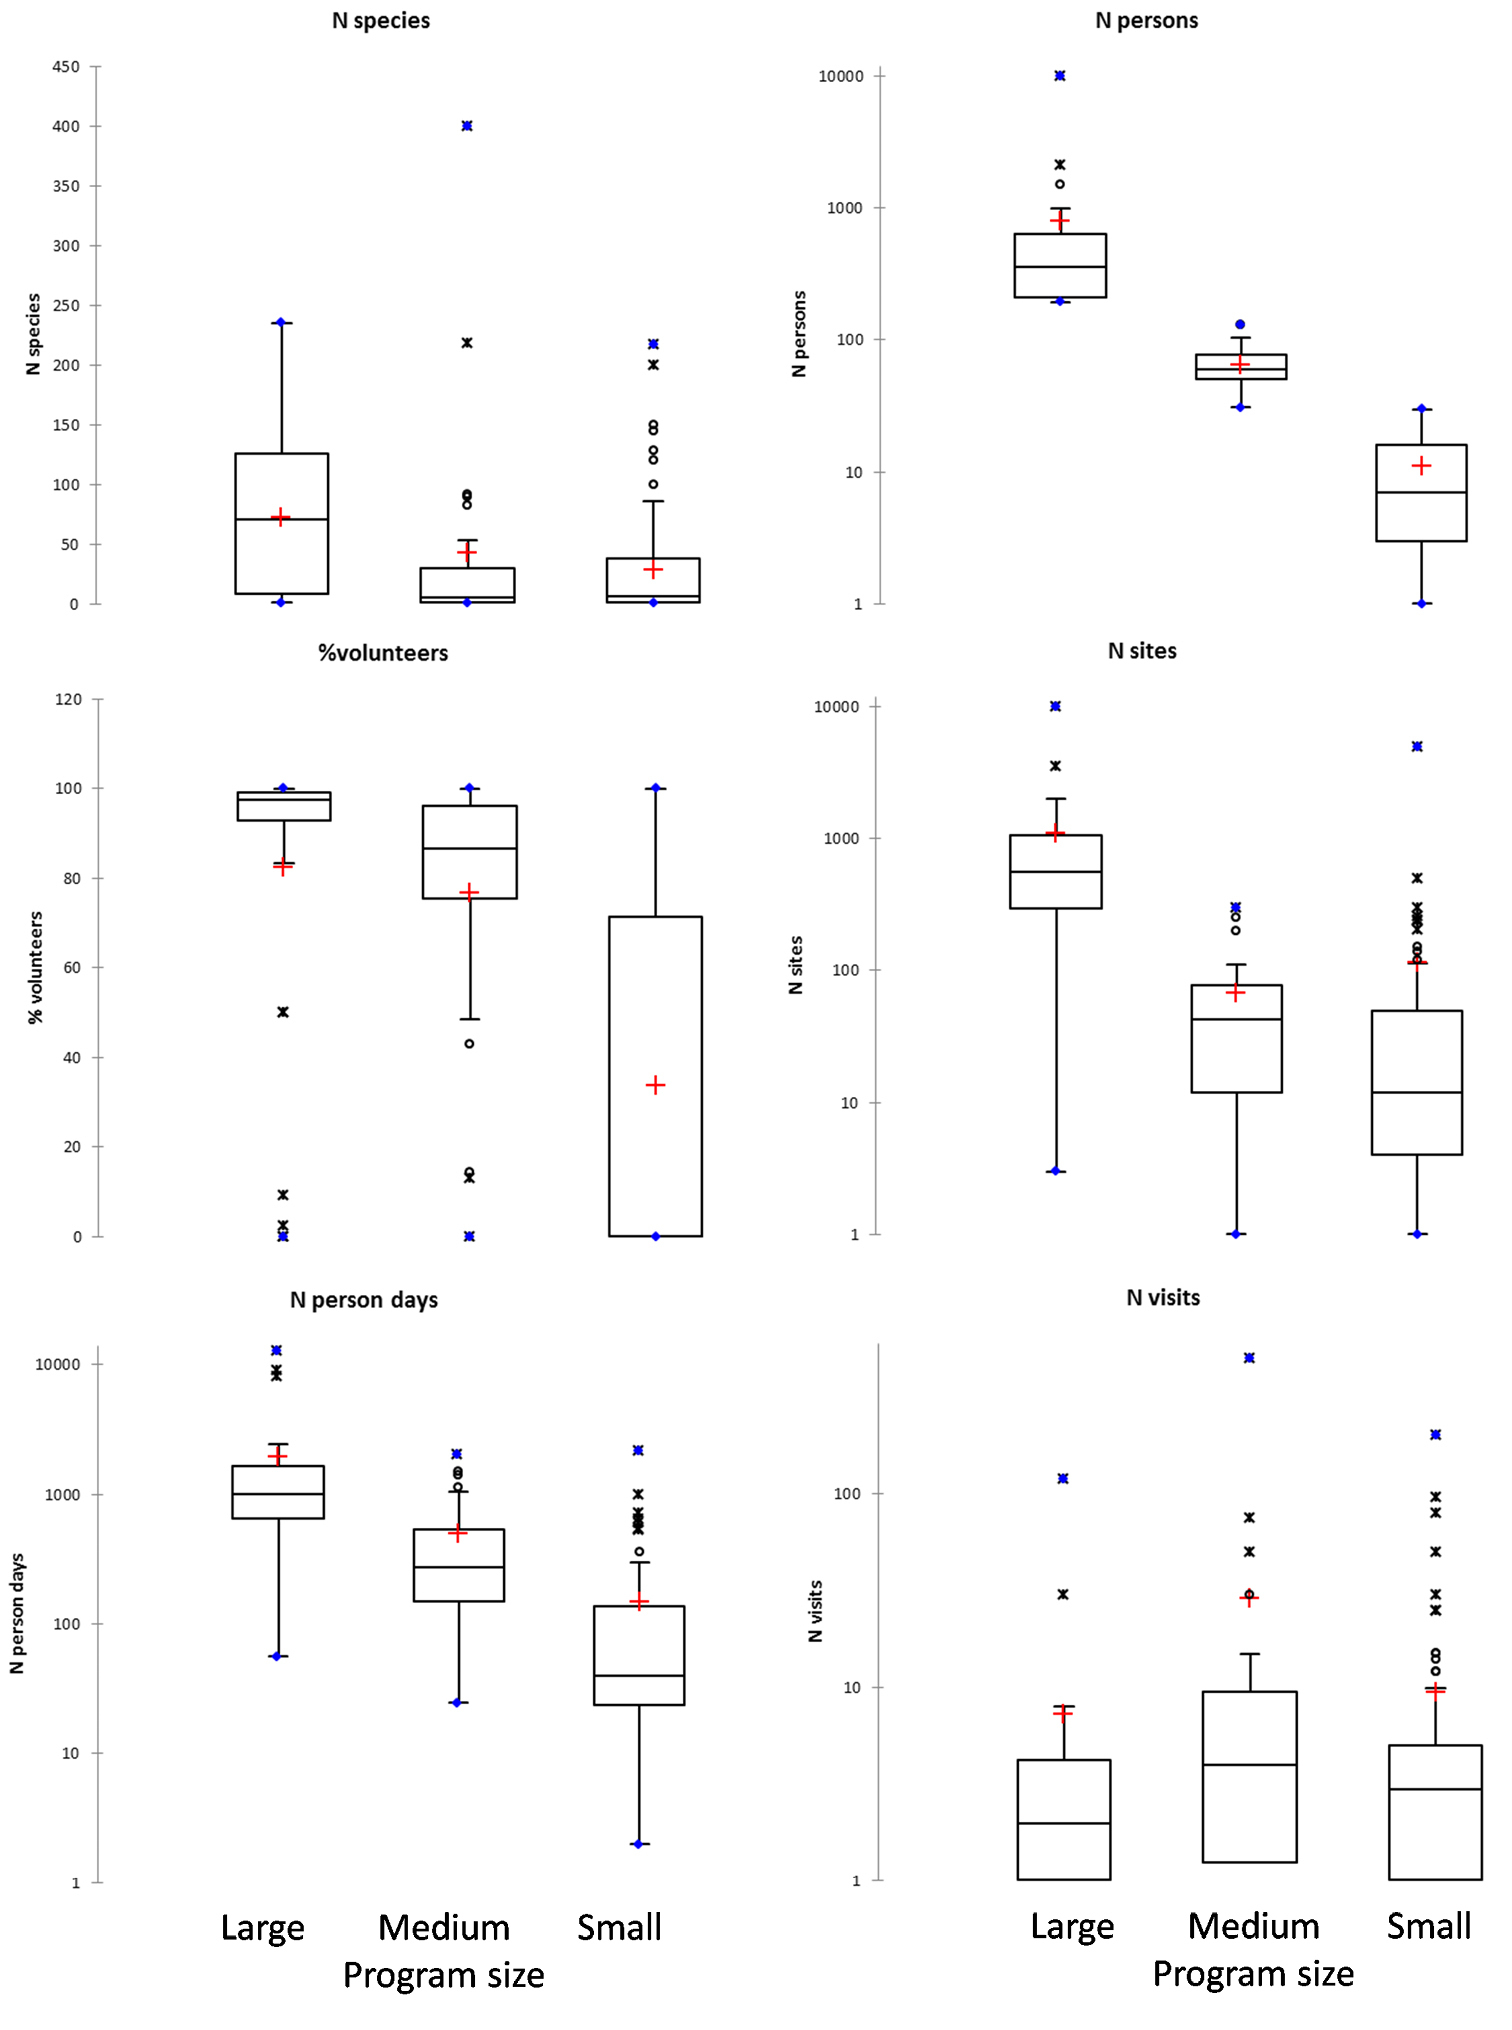
Univariate boxplots on the sampling effort and proportion of volunteers for small, medium and large European bird-monitoring programs (the size of a monitoring scheme was defined mainly by the number of people involved).
The main factors of ecological change that coordinators considered that they could assess with their monitoring data were land use change in small and medium programs (Table 1). In large programs, a majority of programs monitored land use changes and climate change impacts (Table 1). The distributions of the ecological factors monitored differed significantly between the differently sized monitoring programs (χ²2 = 6.879, p = 0.032; Table 1). In all three categories of monitoring programs, population trends were the first target of the monitoring. Community trends were least monitored across all programs sizes (Table 1). Most of the small and medium programs were scientific programs. In medium programs, many also had a management motivation (34.6%), while the large programs included 34.4% scientific, 28.1% political and 25% management programs (χ²2 = 1.294; p = 0.523; Table 1).
Summary of responses of European bird species programs to questions on the motivation and aims, and the sampling design. The values are given for small, medium and large programs as defined by the number of people involved in the monitoring (see also text). For more information on the questions, see the supplementary material ESM 1, which is available online.
| Small N (%) | Medium N (%) | Large N (%) | ||
|---|---|---|---|---|
| Motivation and aim | ||||
| causes of change a program monitors | ||||
| Land use | 46 (56.8%) | 15 (57.7%) | 20 (62.5%) | |
| Climate change | 20 (24.7%) | 11 (42.3%) | 17 (53.1%) | |
| Habitat fragmentation | 19 (23.5%) | 3 (11.5%) | 8 (25.0%) | |
| Pollution | 18 (22.2%) | 3 (11.5%) | 9 (28.1%) | |
| Invasive species | 9 (11.1%) | 4 (15.4%) | 8 (25.0%) | |
| Reason for launching a program | ||||
| Scientific | 33 (40.7%) | 11 (42.3%) | 11 (34.4%) | |
| Political | 24 (29.6%) | 4 (15.4%) | 9 (28.1%) | |
| Management or restoration | 21 (25.9%) | 9 (34.6%) | 8 (25.0%) | |
| Other | 2 (2.5%) | 2 (7.7%) | 4 (12.5%) | |
| Monitored trends | ||||
| Population trends | 79 (97.5%) | 26 (100%) | 31 (96.9%) | |
| Distribution trends | 44 (54.3%) | 16 (61.5%) | 25 (78.1%) | |
| Community trends | 41 (50.6%) | 5 (19.2%) | 7 (21.9%) | |
| Sampling design | ||||
| Choice of site | ||||
| Personal or expert knowledge | 46 (65.0%) | 9 (37.5%) | 12 (37.5%) | |
| Exhaustive sampling | 26 (32.5%) | 10 (41.7%) | 4 (12.5%) | |
| Systematic sampling | 4 (5.0%) | 2 (8.3%) | 2 (6.3%) | |
| Other | 3 (3.7%) | 3 (12.5%) | 5 (15.6%) | |
| Random sampling | 1 (1.3%) | - | 9 (28.1%) | |
| Field data type | ||||
| Age | - | - | 1 (3.1%) | |
| Counts | 53 (65.4%) | 14 (53.8%) | 24 (75.0%) | |
| Mark-recapture | 16 (19.7%) | 7 (26.9%) | 2 (6.3%) | |
| Presence-absence | 8 (9.9%) | 3 (11.5%) | 2 (6.3%) | |
| Phenology | 4 (4.9%) | 2 (7.7%) | 3 (9.4%) | |
| Monitored area legally protected | ||||
| Both, within and outside a reserve site | 49 (61.3%) | 17 (65.4%) | 28 (87.5%) | |
| Within reserve site | 21 (26.3%) | 3 (11.5%) | - | |
| Outside reserve site | 10 (12.5%) | 6 (23.1%) | 4 (12.5%) | |
| Data processing | ||||
| Detection probability | 28 (35.0%) | 9 (36.0%) | 14 (46.7%) | |
| Stratification | 18 (22.2%) | 8 (30.7%) | 12 (37.5%) | |
In small programs, sites were mainly chosen through expert knowledge (Table 1). In medium programs, sampling was most frequently exhaustive or based on site choice according to expert knowledge (Table 1). In large programs, random sampling and site choice by expert knowledge was most frequently employed (Table 1). Whether monitoring was conducted within and/or outside a protected area was independent of monitoring program size, as was the field data type that were most frequently used (Table 1). The issue of detection probability was neglected in all types of programs (χ²2 = 0.092; p = 0.955), ranging from 35% of the total number of small programs to 46.7% (large programs). The same result was found for the application of stratified sampling (χ²2 = 2.656; p = 0.265; Table 1). In small and medium programs, basic statistics (descriptive statistics or correlations) were most frequently used, while large programs may have more frequently used more advanced statistics (χ²2 = 3.348; p = 0.188).
Several monitoring programs focused on one of the three bird species groups, raptors (N = 16), waterbirds (N = 44), and songbirds and near passerines only (N = 27). Raptor programs monitored 4.8 +/- 1.3 species (median = 3) with 42.6 +/- 16.3 persons (median = 11), which were mainly professionals (58% +/- 11.6; median 14.3%), investing 392.5 +/- 127.9 days per year, visiting 164.1 +/- 91.5 sites (median = 23) on 3.7 +/- 1.0 times (median = 2). The majority of raptor programs did not consider detection probability nor stratification (87.5%), but followed an exhaustive sampling design (56%) and analyzed data with basic statistics only (12.5%). Waterbird programs monitored 16.9 +/- 4.1 species (median = 1) with 138.9 +/- 52.6 persons (median = 30), which were mainly volunteers (52% +/- 6.2; median 60.0%), investing on average 869.4 +/- 374.5 days per year, visiting 294.3 +/- 111.1 sites (median = 50) on average 22.3 +/- 12.1 times (median = 2). In waterbird programs 25% considered detection probability and 20.5% stratified their sample. The sampling design was either exhaustive (36.4%) or following expert knowledge (47.7%), while only 9% employed random or systematic sampling. Songbirds and near passerine programs monitored 26.0 +/- 8.0 species (median = 12) with 400.7 +/- 369.3 persons (median = 22), which were mainly volunteers (59.8% +/- 8.4; median 87%), investing on average 222.2 +/- 72.5 days per year, visiting 409.3 +/- 383.7 sites (median = 10) on average 11.8 +/- 3.4 times (median = 2). Songbirds and near passerine programs accounted for detection probability in 63% and used stratification in 26% of the programs. Most of the programs (74.1%) used a sampling design following expert knowledge and used advanced statistics (63%) for data analysis.
Sampling and data processingThe field data type largely depended on the program objective (χ²2 = 10.11; p = 0.006): programs with a scientific motivation more frequently employed mark-recapture studies (35%) as compared to management/restoration programs (10.5%), while politically motivated programs did not employ mark-recapture methods at all. Conversely, counts were used less frequently in scientific programs (46%) as compared to management/restoration programs (71%) and programs with a political interest (84%).
Site choice methodology was related to the proportion of volunteers involved (χ²1 = 4.67; p = 0.031). Programs with more professionals than volunteers employed systematic sampling or chose sites based on expert knowledge, while programs with exhaustive or random sampling were dominated by volunteers. Consideration of detection probability was related to the program objective (χ²2 = 16.71; p < 0.001): scientifically oriented programs accounted more often for detectability than other programs, although still 46% of the scientifically motivated programs ignored the problem of detection probability as did 66.7% for management programs and 82.8% for political programs. Stratification was used in few programs (31% of scientific programs; 23.7% of management programs; 16.2% of politically motivated programs; χ²2 = 2.043; p = 0.36).
Advanced statistics (i.e. GLM, or Generalized Additive Models) were more likely used for data analysis with increasing total sampling effort (number of person days) and varied with the program objective (respectively, χ²1 = 11.58; p < 0.001; χ²2 = 14.76; p < 0.001); 62.5% of the scientific programs used advanced statistics, 47% in management programs, and 23.5% in politically motivated programs. The level of statistical data processing (use of basic or advanced statistics) was not related to the sampling design (χ²4 = 6.04; p = 0.196).
DiscussionThe majority of programs of our database comprised of small programs, i.e. monitoring few bird species with few people. These programs were homogeneous in terms of practices for monitoring bird populations on a local scale using counts or even capture-mark-recapture data to monitor population trends in detail. Capture-mark-recapture data were usually collected in scientifically motivated programs at sites chosen by experts. Fewer programs were medium-sized, focusing on populations on a local to regional scale, using count data and an exhaustive sampling design. The large monitoring programs sampled count data, while selecting sites either randomly or following expert opinion.
Monitoring programs share the common desire to determine what changes are occurring in bird populations and why these changes occur. Programs at different scales are needed to address these questions, although their primary aims may differ depending on the scale of implementation. Large-scale monitoring programs across biogeographic regions, countries or a continent are usually designed to determine if population changes are occurring. However, the design of large-scale programs is too coarse to provide information on changes at specific sites or to provide direct information on the causes of population change. Here, small-scale monitoring programs are needed to analyze why population change is occurring at specific sites. Such local-scale data can then feed into management and conservation actions for specific sites. With these differences in mind, it is little surprising that population trends are by far the most frequently monitored trend, regardless of the size of the monitoring program.
Due to the aims of a local scientific program, few employed random sampling, while site selection was done according to expert knowledge. While such a design is suitable for specific (scientific) questions, a subjective sampling effort in general must be considered as a poor design for a monitoring program since it provides a biased coverage of the mechanisms at play, without characterizing the biases. Surprisingly, our data suggest that random sampling, while highly recommended, was employed by only 28% of the large-scale programs and hence 72% did not follow the recommendations of good monitoring practices (
Concerning data collection, bird-monitoring data were usually counts, largely dominating across all monitoring programs in our database. Resource intensive capture-mark-recapture studies (Vořišeket al., 2008) were usually conducted at local and regional scales. The small and locally focused monitoring programs, however, need to be put into a large-scale perspective to determine if changes are due to local or external factors. Such a consideration is important for a generalization of trends across geographic and temporal scales. Therefore, it is important that the results from small monitoring programs are interpreted relative to changes at the population level. They can then serve as benchmark sites for large-scale monitoring programs, thereby providing in-depth information at specific sites (
In respect to the determination of the causes of change in population trends, it is also important to monitor sites in and outside of protected areas since the pressures are different. Our data suggests that this notion is well implemented in bird-monitoring in Europe, improving our ability to generalize results by comparing population changes within and outside of protected areas. Such comparisons are of special importance to disentangle large-scale factors (such as climate change), from more local effects (such as habitat fragmentation and pollution for instance).
Concerning sampling stratification, we also found a difference between the differently sized programs, which is likely to be related to the differences in the aim and design of small to large programs. In small programs, stratified sampling was applied in only 22.2%, while in large programs the proportion raised to 37.5% (30.7% in medium programs). For local and regional programs such a proportion might be sufficient since homogeneity of the sample population is higher at a smaller scale. In contrast, stratified sampling must be employed more frequently in large-scale programs due to limited resource and sampling disequilibrium between potential strata.
The largest deficit in the consideration of recommendations was the lack of repeated sampling to account for detection probability. Only little more than a third of programs employed repeated sampling, usually programs with a scientific motivation. Programs with management objectives and with a political motivation employed repeated sampling even less often, making them more prone to misinterpretation of trends that may be due to variations in detection probability (
Generally, our data show that there is a huge variety of monitoring practices across all monitoring programs, among and within bird species groups, partly explained by the program objective, and the scale of the implementation of programs. It appears to be justified to recommend that bird-monitoring in Europe may step up the effort in methodological implementation of monitoring recommendations (
The culture of bird-monitoring was born and propagated by visionary bird watching and naturalist amateurs, led by skilled professionals. This enabled the founding of long-term databases with minimal funding. Due to this historical contingency, the involvement of volunteers in monitoring is still key to maximize the sampling effort and to acquire a large-scale image of changes in bird diversity (
In the monitoring literature a three-phase approach is described for the process of biodiversity monitoring, (i) identifying monitoring questions and aims, (ii) identifying the most suitable monitoring methods, and (iii) interpreting monitoring data (
This contribution was supported by funds of the EuMon STREP EU-project (EU-Commission contract number 6463). We would like to thank Ian Burfield for his substantial contribution to this publication and language revisions, the editor and two anonymous reviewers for their helpful comments. We further thank all the contributors of monitoring program descriptions, who spent their precious time answering our questions, and our colleagues who helped in assembling this database, particularly P. Nowicki, E. Budrys, M. Kotarac, B. Gruber, and B. Ivanek. This database is publicly available at http://eumon.ckff.si/monitoring/search.php.
Supplementary material to article European Bird-monitoring - an overview. (doi: 10.3897/natureconservation.2.3644.app) File format: MS Word Document (doc).
Explanation note: The questionnaire was designed to assess how biodiversity monitoring schemes were carried out and what the motivation was to launch that scheme.
Note: The following is a transcript of the questions coordinators answered in the online questionnaire available at: http://eumon.ckff.si/monitoring . The online version also contains clarifications and explanatory notes.