Nature Conservation 2: 21–40, doi: 10.3897/natureconservation.2.2351
Global Change Projections for Taiwan Island Birds: Linking Current and Future Distributions
Chia-Ying Ko 1,2,3,4,5, Terry L. Root 1, Shu-Hua Lin 6, Stephen H. Schneider 7,†, Pei-Fen Lee 2
1 Woods Institute for the Environment, Stanford University, Stanford, CA 94305, USA
2 Institute of Ecology and Evolutionary Biology, National Taiwan University, Taipei, 106, Taiwan (R.O.C)
3 Department of Ecology and Evolutionary Biology, Yale University, CT 06520, USA
4 School of Forestry and Environmental Studies, Yale University, CT 06511, USA
5 Delta Electronics Foundation, Taipei 114, Taiwan (R.O.C)
6 Global Change Research Center, National Taiwan University, Taipei 106, Taiwan (R.O.C)
7 Department of Biological Studies & Interdisciplinary Environmental Studies, Stanford University, Stanford, CA 94305, USA
Professor S. H. Schneider died on 19 July 2010 at the age of 65.

Corresponding author: Pei-Fen Lee (leepf@ntu.edu.tw)

Academic editor: Yu-Pin Lin

received 11 November 2012 | accepted 2 April 2012 | Published 24 August 2012


(C) 2012 Chia-Ying Ko. This is an open access article distributed under the terms of the Creative Commons Attribution License 3.0 (CC-BY), which permits unrestricted use, distribution, and reproduction in any medium, provided the original author and source are credited.


For reference, use of the paginated PDF or printed version of this article is recommended.

Abstract

The earth is warming rapidly. Species around the world must adapt to the increasing heat and to the rapid rate of temperature change. Decision makers and managers must aid species to adapt and to keep up with the changes if they are not able to do so on their own. Special attention needs to be paid to small islands because they are at high risk for the loss of unique and threatened systems and species, and face habitat loss as a consequence of climate-induced rises in sea level. In this study, we examined 17 endemic avian species on the island of Taiwan. Bird observations from 1993 to 2004 were compared to modeled distributions for 2020, 2050, 2080 and 2100. We used 5 general circulation models (CCCMA, CCSR, EHAM4, GFDL, and HADCM3) for the Intergovernmental Panel for Climate Change A2 and B2 scenarios. Results show that the distributions of 15 out of 17 species are predicted to shift up in elevation with warming. As the lower distributional limits contract to higher elevation, the upper edge of their current distributions cannot shift up in elevation because they were already near or at the tops of the mountains. Consequently, their distributions are predicted to shrink over time. The median elevation of each of these species’ distributions is higher than the median elevation of all available habitats on Taiwan. In addition, we find that a few common species are predicted to become rare species under climate change. Two of the 17 species examined are not near the tops of the mountains and are the only species that have median elevations of their distributions lower than the median of all available habitats on Taiwan. These 2 species are predicted to expand the upper-elevation distribution limit but not to contract the lower-elevational limit, which results in a widening of their distributions. Hence, we suggest that the median elevation of a species’ current distribution plays a key rule and can be further used as an index of the response birds most likely will exhibit as the temperature increases.

Keywords

Climate change, projection distribution, island species, endemism, geographic patterns

Introduction

The earth’s ambient temperature is increasing at an alarming rate and magnitude. These increases are producing changes in natural systems (Schneider and Root 2002, Walther et al. 2002, Hampe and Petit 2003, Parmesan and Yohe 2003, Root et al. 2003). Root and coauthors (2005) found that anthropogenic forcing factors are the main causes of the discernible influences on biological systems, and an expansion that included physical and more biological systems is reported by the Intergovernmental Panel on Climate Change (IPCC: Parry et al. 2007) and by an update to the IPCC (Smith et al. 2009). Observations over three to five decades show that species are undergoing several different types of adaptive changes related to climate change. Distributions are shifting poleward and to higher elevations, phenological events are occurring earlier in spring, and behavior, morphology and genetics are changing (Parmesan et al. 1999, Pounds et al. 1999, Parmesan and Yohe 2003, Root et al. 2003, Butler et al. 2007, Wiens et al. 2009, Bradshaw and Holzapfel 2010, Emerson et al. 2010).

The risk of extinctions worldwide will likely be exacerbated by climate change that occurs too rapidly to allow species to adapt (Thomas et al. 2004). Island species are at particularly high risk because these species have small ranges and shifting poleward may not be an option (IPCC: Watson et al. 1996). They also face habitat loss produced by climate-induced rises in sea level (Smith et al. 2009). Predicting possible changes in the ranges of species caused by future warming of the earth can offer advance warning. Such predictions can also help policymakers and conservation managers draft viable mitigation and adaptation strategies. This knowledge could help lessen future impacts on natural systems (Wiens et al. 2009). The developments of programs or models that provide accurate species-distribution predictions have made gradual progress. Projections from these models increase our understanding of possible ecological consequences under various emission frameworks that range from non-mitigation scenarios to idealized long-term scenarios (Wiens et al. 2009).

An appropriate scale and list of environmental factors are both key factors in the prediction of species distributions. Investigating scaling questions is worthwhile on both islands and continents. The choice of a spatial scale to be used in species-distribution models plays an important role in model performance and follow-up applications. However, the available environmental data and species-occurrence records often limit the choice of scale, especially with respect to finer scales (Seo et al. 2009). By definition, averaging environmental information to determine values at a larger grid-cell size results in loss of information within the averaged area. Such loss of information often causes overestimates of potentially suitable areas and may fail to capture many habitat features, including, for example, information about microhabitats that are important to species in an area (Root and Schneider 1993, Ko et al. 2009, Wiens and Bachelet 2010). Other uncertainties, such as mismatches in an overall geographic range of a species in a specific area, may occur when the grid-cell size used to predict species distributions is large (Wiens et al. 2009). Using the finest grid-cell size possible for modeling increases the probability of capturing the factors, which determine species’ realized niches (Wiens et al. 2009). Ko et al. (2009) used a one-square-kilometer grid system to compare four species distribution models in order to predict the current distributions of 17 endemic bird species on the island of Taiwan. These four models were logistic regression (LR), multiple discriminant analysis (MDA), a genetic algorithm for rule-set prediction (GARP), and an artificial neural network (ANN). That study demonstrated good predictive results at this fine spatial scale. Consequently, we adopted a one-square-kilometer grid system for all models in this study.

Selecting appropriate environmental factors for investigating species distribution models is critical when investigating the suitability of models that can be used to aid in conservation efforts for different species. Numerous studies have assessed many environmental factors. These studies have calculated and examined the individual contributions of different environmental factors and their effects on the distribution and abundance of different taxa (Moles et al. 2003, Jafari et al. 2004, Root et al. 2005). These studies provide strong evidence that current values applied to general circulation models (GCMs) can be used to predict species distribution changes.

To provide a comprehensive perspective on the effects of future warming, studies often use predicted changes in temperature and precipitation to simulate the effects of future warming. Various models of future temperature and precipitation have been created under different assumptions about the trajectory of global emissions. The variability in projected precipitation among the different models is quite a bit larger than that for projected temperature. On the island of Taiwan, many factors, including occurrences of typhoons and ocean cycling, cause large variations in precipitation. These variations coupled with the model variations make it difficult to forecast general or specific patterns in the magnitude of future precipitation. Moreover, the temperature showed higher contributions than the precipitation on distributions of the Taiwanese endemic bird species (Ko et al. 2009). For these reasons, projected temperature data from 127 stations (from the Central Weather Bureau of Taiwan) were downscaled and interpolated by multiple regression to the one-square-kilometer grid spatial resolution and precipitation data were not used in this study.

Studies linking the current and future distributions of species are expected to yield useful suggestions about possible indicators for use as reference points for conservation efforts in response to climate change. Current literature on the projection of species distributions, however, involves active debates about questions including uncertainties in species’ dispersal abilities, migration rates, and area sizes of fundamental and realized niches occupied by species (Davis et al. 1998, Huntley et al. 2004, Thomas et al. 2004, Guisan and Thuiller 2005). In this study, we assumed that temperature was the only variable, which means we assumed, for example, that dispersal abilities were not in question and needed habitats were always assumed to be available anywhere on the island. This means we found the largest possible projections of the species distributions and the reality will most likely be smaller than those projected.

The island of Taiwan serves as a representative island for island studies generally. Taiwan, located at the boundary between the tropics and the subtropics, offers a range of topography and biodiversity. Global warming obviously impacts the island: from 1900 to 2010, island temperatures increased by approximately 1.6°C, an increase of 0.13–0.15°C per decade (Fig. 1). Current and projected increasing damage and irreversible loss of unique and threatened natural systems have attracted attention because Taiwan is a prioritized conservation hotspot in Asia (Myers et al. 2000, Lei et al. 2003, Lei et al. 2007). Many different types of data are available for numerous species on Taiwan. For example, data on more than 150 bird species have been collected at different locations since 1993. These data allow investigations to be carried out for different taxa at various elevations. Accordingly, the island serves as an example of processes occurring on small islands with significant topography, in general.

Figure 1.

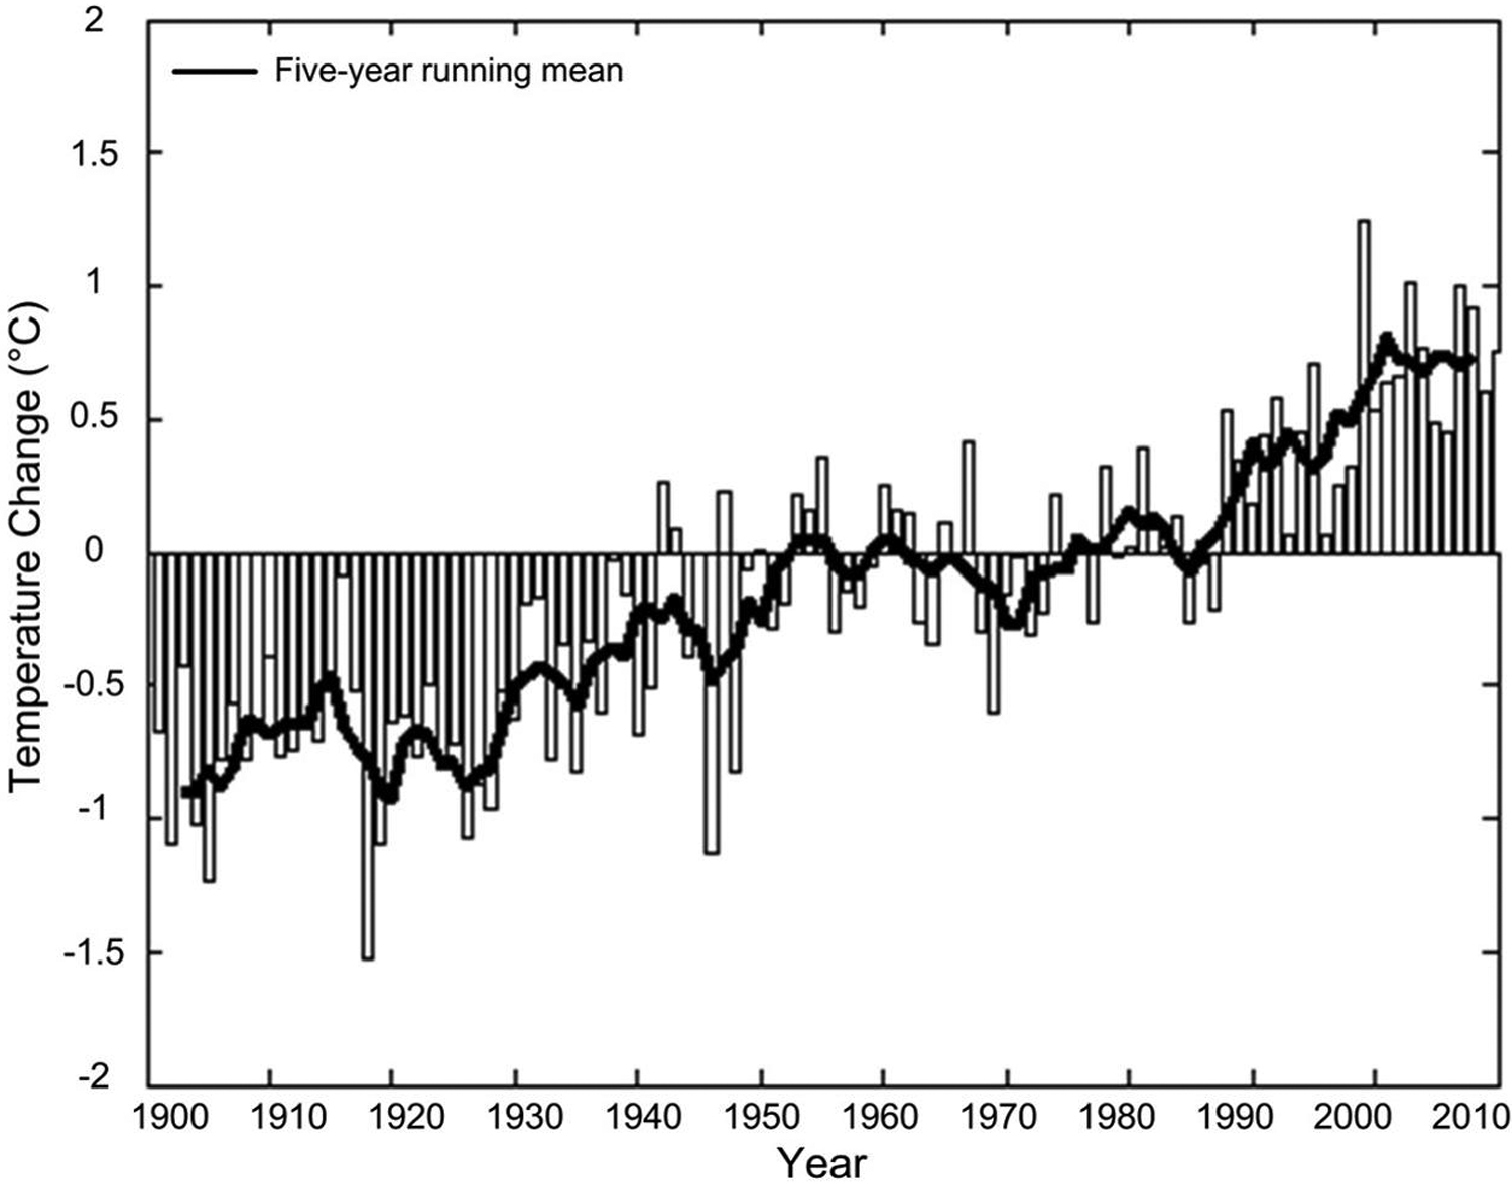
The increase in the observed annual mean temperature on Taiwan from 1900–2010. Temperature change in each year was calculated by comparison of the annual mean temperatures averaged from 1990 to 1999.

We assumed that species distributions will shift in elevation in concert with warming temperature. Depending on the physiological ecology of the species in question and compiling studies projecting species ranges (Walther et al. 2002, Sekercioglu et al. 2008, Bradshaw and Holzapfel 2010, La Sorte and Jetz 2010a, 2010b), we made a simple assumption that species unable to tolerate a warming climate would shift up into higher elevations and perhaps contract the original ranges in lower elevations. We examined the relationship between current distributions of birds over the elevational gradient and distributions predicted as a result of future warming. The purpose of this study is to estimate how climate change affects bird species on a small island based on current associations over 12 years between species occurrences and temperature, and to identify inherent or external factors that might influence their future distributions, which can further be used as a conservation index. We focused on 17 Taiwanese endemic bird species and 10 projected temperatures (see below) to estimate possible future changes in the patterns of species distributions and to assess the relationships among these factors.

Materials and methods Species data

We obtained occurrence data for the 17 Taiwanese endemic species from a 12-year inventory of avifauna from 1993 to 2004 (Hsu et al. 2004, Koh et al. 2006). Sampling sites were selected to represent the habitat characteristics of a particular elevation, forest type, and ecoregion. Each site, 150 m and 200m apart individually within a 1.5–3-km-long transect, was sampled once a year during the breeding season or seasonally for 2–3 years during the period 1993–2004. The data were not collected from all of the sampled sites in each census year owing to limited sampling resources. An individual site was surveyed 10–12 separate times, on average, in those 2–3 sampled years. The precise locations of the sampled sites were recorded using a Global Positioning System (GPS). These location data were transformed to a one-square-kilometer grid system. We categorized the grids as species present, absent or nonsurvey, and we ignored the abundance of individual species within a grid. If one individual was seen in a grid box, it was categorized as present. A total of 4, 082 grids were surveyed, which was approximately 11% of the area of Taiwan. Due to our census restrictions, there are undoubtedly more locations where a species was present but we did not observe it, and hence a grid box could have been labeled as species absent when the species was actually present. In order to avoid those uncertain species-absent records to affect follow-up species predictive distributions, we used species-presence records only in the models of this study.

Current and future temperature data

We obtained monthly mean temperature data from the Central Weather Bureau of Taiwan form 1990 to 1999 at 25 long-term climate-monitoring stations and 102 locations where there were only temperature recording equipment and auto-rain gauges of the Central Weather Bureau of Taiwan. We averaged temperature in those 10 years in each grid cell and used these as a surface showing of current annual mean temperature. High-resolution gridded climate data are required for spatial analysis of a small region with complex terrain and diverse climate states. The data-assimilation method, a technique using statistical analysis and interpolation to integrate irregularly distributed observation into regular model grids (Wang et al. 2000), used multiple variants regression incorporating observations, coarse-grid reanalysis data, and physiographic features to generate one-km high-resolution grid temperature data (Lin and Lin in review).

To make sure the temperature data used in this study were the most suitable and representative, we compared temperature data from a widely used global climate dataset WorldClim (http://www.worldclim.org/ ) developed by Hijmans et al. (2005) to a temperature data set developed specifically for Taiwan by Lin et al. (2010). The current temperature differed markedly between the two datasets, especially in the 19–21°C and 22–24°C ranges. The WorldClim data contained more areas within the 19–21°C range, whereas the temperature data that we used contained more areas within the 22–24°C range. The ranges of average annual temperature simultaneously showed a significantly difference (p<0.05) between the WorldClim data and Lin et al.’s data, primarily caused by the two sets of data covering different time periods: 1950–2000 for WorldClim and 1990–1999 for the Lin et al. data. Comparisons to temperatures in Taiwan from Wu et al. (2008) since 1970, which covered a whole period of the avain censused years in this study, showed that the temperature of the whole Taiwan generated by the 1990–1999 period was more similar than that of the 1950–2000 periods. Thus, we adopted the projected temperature originated from the 1990–1999 temperature data by Lin et al. (2010) in this study instead of using the WorldClim dataset.

We obtained projected temperature trends, which had been specifically and locally downscaled to the 1×1km fine resolution in Taiwan by the same regression-based statistical downscaling approach (Lin et al. 2010), from five GCMs for the A2 and B2 emission scenarios from the IPCC Fourth Assessment Report: (i) CCSR: Centre for Climate System Research, (ii) CCCMA: Canadian Center for Climate Modeling and Analysis, (iii) ECHAM4: European Center for Medium Range Weather Forecasting, (iv) GFDL: Geophysical Fluid Dynamics Laboratory, and (v) HadCM3: United Kingdom Meteorology Office.

The A2 and B2 scenarios were treated as antithetical frameworks. Taken together, they provided individual alternative scenarios for ways in which the future might unfold, according to the IPCC Special Report on Emissions Scenarios in 2007. The two scenarios were derived from different assumptions about the release of greenhouse gases and aerosols into the atmosphere. They are used to explore future demographic, social, economic, technological and environmental developments on a global scale (Nakicenovic et al. 2000). The A2 scenario represents a heterogeneous world with a continuously increasing global population and regional economic growth. These levels are higher than those assumed by the B2 scenario.

The original data from the GCM scenario-run outputs, adjusted for 1990s means, were first downscaled to local weather stations. They were then further adjusted by linking the normalized probability distribution functions of deviations of the monthly mean climate parameters. Finally, a linear interpolation method was used to generate interpolated climate-change surfaces. These surfaces gave values that, added to observed base temperatures, yielded the projected temperatures. Five projected-temperature models (i.e. CCSR, CCCMA, ECHAM4, GFDL, and HadCM3) for each of the A2 and B2 scenarios were used to predict the study species’ future distributions.

We used four temporal snapshots of the future changes in species distributions: 2020, 2050, 2080, and 2100. These years represented separate short-term, mid-term, and long-term climate-change influences on species distributions. To avoid chaotic weather fluctuations in the projected temperatures in one year, we used the average temperature from the prior 10 years for each year (e.g., the temperature projected for 2020 was calculated from 2010–2019).

Model use and statistical analysis

A maximum-entropy approach (i.e., Maxent) (Phillips et al. 2006), which individually analyzes the weights of environmental factors and calculates a continuous probability value for each species’ distribution and has been estimated its high predictive performance among the Taiwanese species taxa (Lee et al. 2010, Ko et al. 2011), was used to project the future potential distributions. With five GCMs, two scenarios, and four snapshot years, each species distribution was predicted by a total of 40 models. We ran each model for 1000 iterations and then chose the values of the 10th percentile of presence as a threshold to derive categorical values of species presence and absence from the calculated probability values. Projected-distributional probabilities of each species for each year in all models were switched to presence-absence values, which were used only in follow-up analyses. Projections of species distributions were first separated according to the two scenarios. Projected species-present grids of each species for each year from the five models in a scenario were individually normalized by calculating numbers of the grids where a species occurred compared to the total number of grids over all of Taiwan’s. These proportions from all five models were then averaged by species for each of the snapshot years. Hence, each species was assigned an average proportion value for its distribution area in each year. The slope over the four snapshot years was then determined for both A2 and B2 scenarios for each species. We compared the differences between A2 and B2 scenarios with a paired t-test using SYSTAT 12.

Species’ current distributions given in Ko et al. (2009, 2010) and topographical data of the whole Taiwan (Ko et al. 2010) were used to analyze species geographical changes from current and future warming temperature. The 17 endemic species generally favored habitats with high vegetation cover, at almost full forest cover and median to high NDVI, but occupied heterogeneous elevation and climatic conditions when comparing their distribution species by species in depth. In grid boxes with values greater than the 10th percentile a given species was considered as species presence areas. The distribution was plotted for each of the snapshot years for each species.

Results

The projected future temperatures in Taiwan generated by the five models for the A2 and B2 scenarios showed increasing trends (Fig. 2a, 2b). The projected temperature by the five models for each temporal snapshot were different between A2 and B2 scenarios (p>0.05 in 2020 and 2050 and p<0.05 in 2080 and 2100) (Fig. 2c). In 2020 and 2050, projected B2 values were higher than those of A2, whereas the values in 2080 and 2100 showed A2 averages higher than B2. The averaged values of the projected increase in temperature ranged from 0.2°C to 3.1°C for the A2 scenario from 2020 to 2100, respectively, and the corresponding range for B2 increased from 0.4°C to 2.2°C, respectively.

Figure 2.

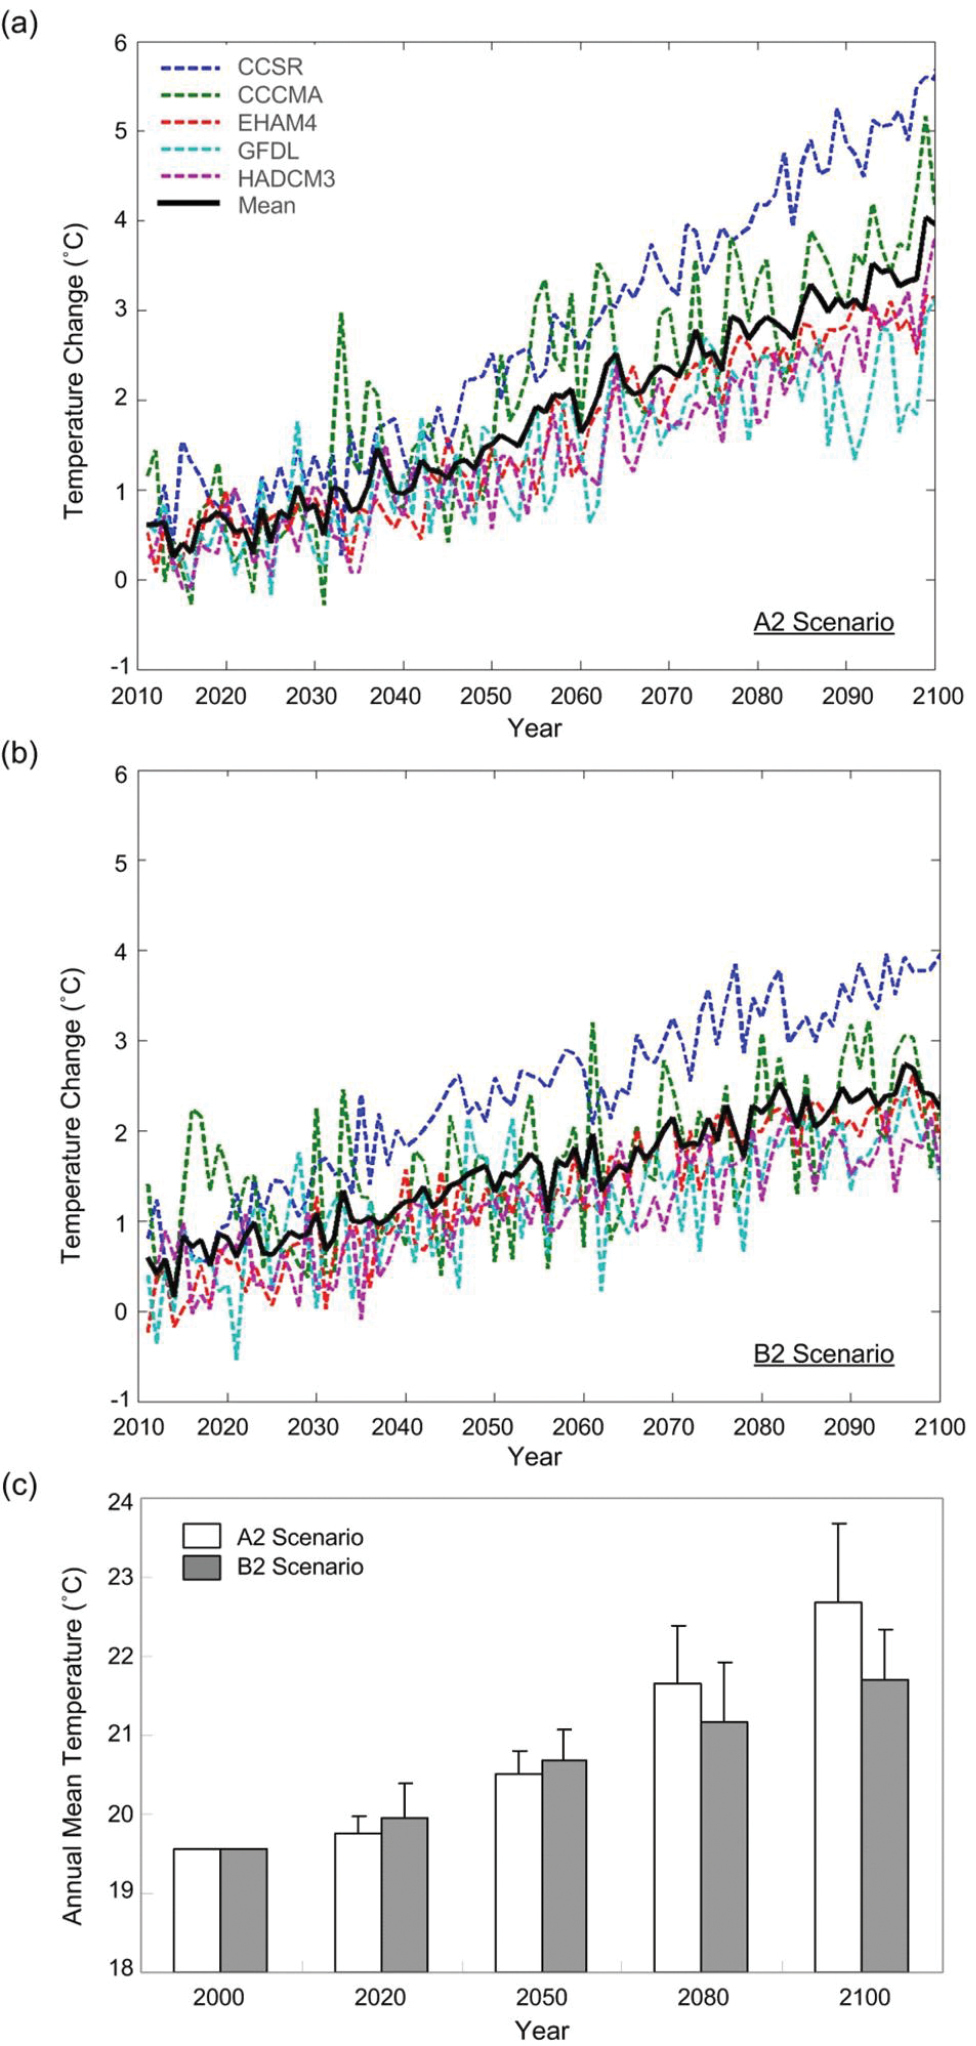
Changing temperature patterns in Taiwan. a projected temperature for 2010–2100 from five general circulation models (CCCMA, CCSR, EHAM4, GFDL, and HADCM3) under the A2 emission scenario b projected temperature for 2010–2100 from five models under the B2 emission scenario, and c average projected temperature from four temporal snapshots, 2020, 2050, 2080, and 2100. The temperature in 2000 is presented for the current climate. The temperature change is from the averaged annual mean temperature from 1990 to 1999.

Fifteen of the Taiwanese endemic bird species were projected to decrease in distribution by 2100, whereas two species, the Styan’s Bulbul (Pycnonotus taivanus) and the Taiwan Hwamei (Garrulax taewanus), were predicted to increase (Table 1). A comparison of the actual observed elevation ranges and medians showed that the two “increasing-distribution” species occupied ranges whose median elevation was below the overall median elevation of Taiwan (Table 1).

Table 1.

Seventeen Taiwanese endemic bird species that show changes in the % of Taiwan grip boxes where the species was present (i.e., positive or negative slope) during 2020–2100 under the A2 and B2 projected scenarios and grid features of the elevation of their distributions.

English Name Scientific Name Increasing/Decreasing Distribution (Slope) Species’ Currently Occupied Elevation (m)
A2 scenario B2 scenario Range Difference Median IQR*
Taiwan 0-3707 3707 381 1194
Decreasing-Distribution Species
Taiwan Barbet Megalaima nuchalis -11.0 -7.6 2–2956 2954 415 629
Formosan Whistling-Thrush Myophonus insularis -5.6 -3.4 7–2764 2757 720 890
Taiwan Partridge Arborophila crudigularis -5.5 -3.3 18–2630 2612 1125 933
Formosan Magpie Urocissa caerulea -4.3 -2.8 7–1487 1480 406 439
White-eared Sibia Heterophasia auricularis -4.3 -2.5 7–3358 3351 1425 969
Swinhoe’s Pheasant Lophura swinhoii -4.1 -2.4 100–2457 2357 1389 760
Taiwan Yuhina Yuhina brunneiceps -4.1 -2.4 7–3358 3351 1587 893
Steere’s Liocichla Liocichla steerii -3.3 -1.9 98–3155 3057 1639 799
Taiwan Bush-Warbler Bradypterus alishanensis -3.2 -1.9 147–3422 3275 2179 969
Collared Bush-Robin Tarsiger johnstoniae -2.9 -1.8 100–3707 3607 2284 699
Yellow Tit Macholophus holsti -2.9 -1.6 7–2815 2808 1622 615
White-whiskered Laughingthrush Garrulax morrisonianus -2.8 -1.7 100–3707 3607 2338 706
Taiwan Barwing Actinodura morrisoniana -2.8 -1.6 7–3015 3008 2102 597
Mikado Pheasant Syrmaticus mikado -2.8 -1.6 100–2979 2879 2121 623
Flamecrest Regulus goodfellowi -2.6 -1.7 378–3707 3329 2573 654
Increasing-Distribution Species
Styan’s Bulbul Pycnonotus taivanus 3.9 1.6 3–2321 2318 169 259
Taiwan Hwamei Garrulax taewanus 3.2 1.2 2–2735 2733 276 420

*IQR = interquartile range

Estimates of the change (i.e., slope) in the percentage of the distribution areas over the four snapshot years and estimates of the lowest and highest observed elevation of individual species showed no significant difference among the seventeen species (p>0.1) (Table 1). The species-occurrence elevations of the 15 “decreasing-distribution” species were divided into current low- to mid-elevation and mid- to high-elevation species. The division between these two elevations was chosen to be at 1600 m based on the species’ currently occupied elevation (Table 1). The current low-to-mid-elevation species (7 species) exhibited a significant decrease between 2020 and 2100 under both A2 and B2 scenarios (p<0.01) while no significant decrease in the current mid- to-high-elevation species (8 species) (Table 2).

Table 2.

Differences in the percentage of future projected species present in areas of Taiwan between 2020 and 2100 for 15 endemic bird species that showed an expected decrease in distribution as result of climate change. The species’ distributional altitudes were based on occurrence records using the 1600 m median elevation as a threshold for determining current low-mid- (LM) and mid-high-altitude (MH) species. The current conservation status of a species was characterized as common (C), uncommon (U) or rare (R), as defined by Ko et al. (2010), depending on the number of grids in which a species was seen.

English Name Distributional altitude Current
Status
% of Distribution Areas Decrease between 2020 and 2100
A2 scenario B2 scenario
Taiwan Barbet LM C 32.1 23.6
Taiwan Partridge LM C 16.0 10.4
Formosan Whistling-Thrush LM C 16.3 10.8
White-eared Sibia LM C 12.2 7.6
Taiwan Yuhina LM C 11.6 7.3
Formosan Magpie LM U 12.8 8.9
Swinhoe’s Pheasant LM R 12.0 7.8
Steere’s Liocichla MH C 9.4 5.7
Collared Bush-Robin MH C 8.5 5.4
White-whiskered Laughingthrush MH C 8.1 5.2
Yellow Tit MH U 8.4 5.0
Taiwan Barwing MH U 7.9 4.8
Taiwan Bush-Warbler MH U 9.2 5.8
Flamecrest MH U 7.7 5.0
Mikado Pheasant MH R 8.0 4.9

The geographical changes in the species’ future distributions in both the A2 and B2 scenarios indicated that the “decreasing-distribution” species would shift towards high- elevation areas and contract along warming boundaries. The result of this shift would be an overall decrease in distribution (Fig. 3). For example, the Taiwan Yuhina showed a monotonic contraction of its distributions from 2020 to 2050, to 2080, and to 2100 (Fig. 3). The general plots of all 15 “decreasing-distribution” species showed that the species would have greater distributional changes in Western Taiwan than Eastern Taiwan, owing to the relative steepness of the topography on the eastern and western sides of the island. The “increasing-distribution” species would not change their distributions by shifting their lower distributional boundary to a higher elevation. Rather, the projections show they would maintain their lower boundary and shift their upper boundary to a higher elevation. The Taiwan Hwamei (Fig. 3) is an example of this pattern of distributional shift.

Figure 3.

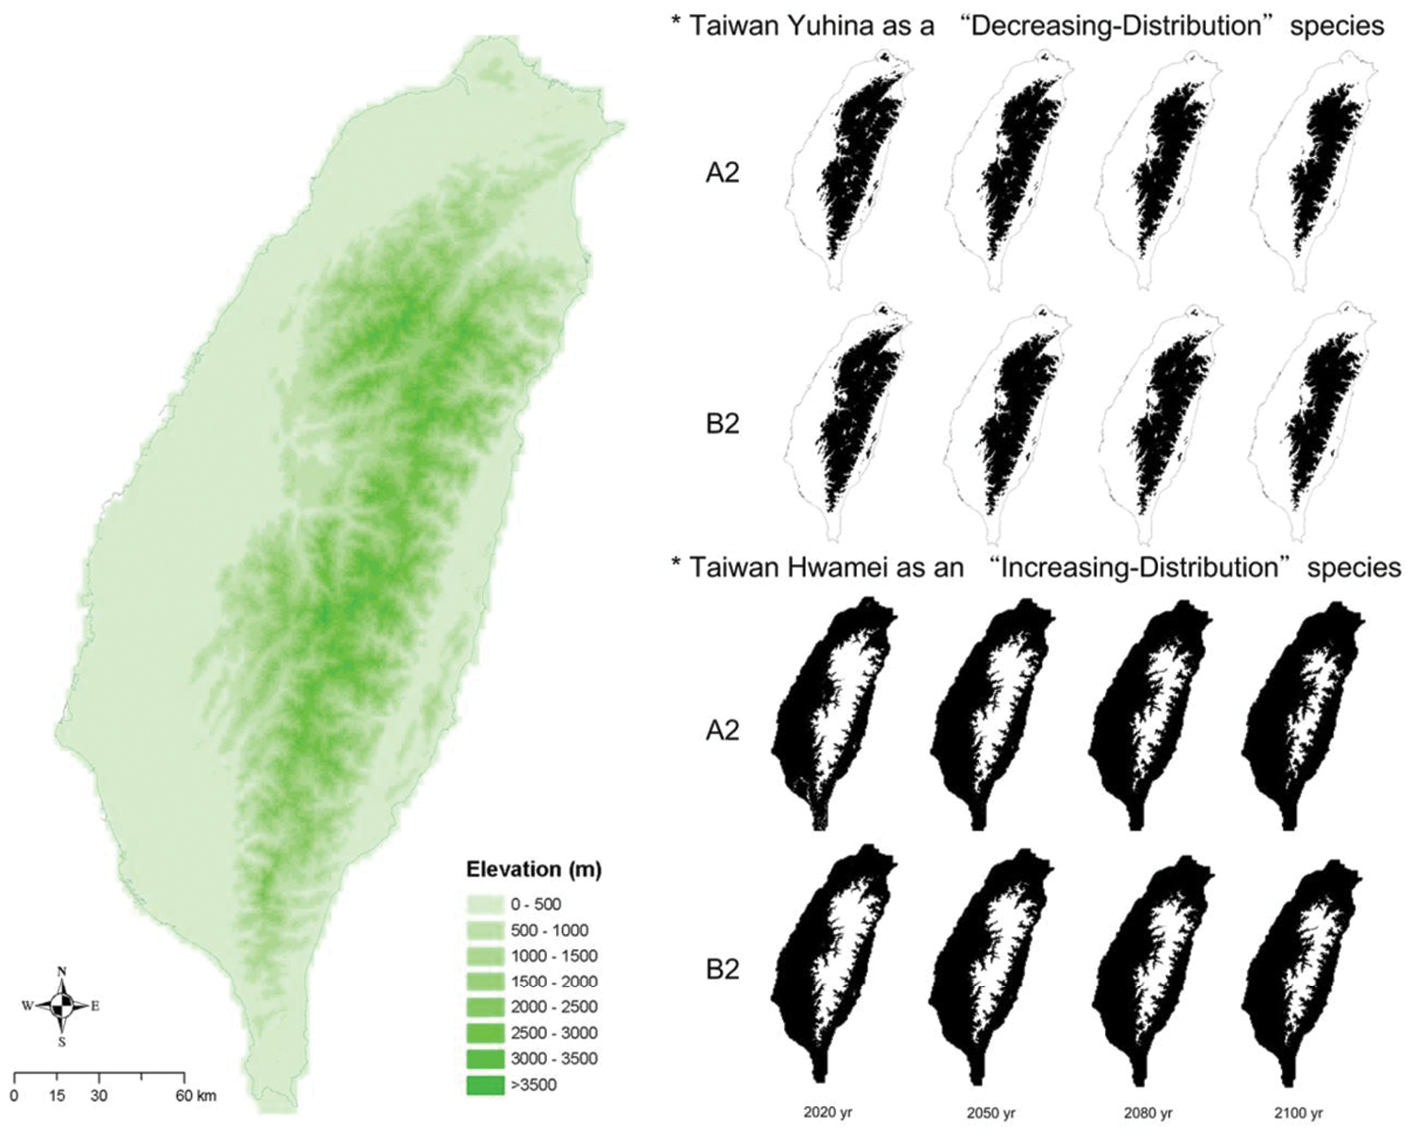
Elevation maps of Taiwan and geographic changes with warming temperature in the projected distributions of Taiwanese endemic bird species in 2020, 2050, 2080, and 2100. The Taiwan Yuhina (Yuhina brunneiceps), an example of a “decreasing-distribution” species (the right-hand upper eight maps), would decrease in distribution as it shifts to higher elevations. The Taiwan Hwamei (Garrulax taewanus), an example of an “increasing-distribution” species (the right-hand lower eight maps) would increase its distribution by moving to higher elevations. The black areas are species’ projected-present distributions, whereas the white areas are species’ projected-absent distributions.

Changing trends in species’ projected occupancy of maximum and minimum elevations revealed differing shift rates that could further explain why a species could increase or decrease (Fig. 4). Under both the A2 and B2 scenarios, the “decreasing-distribution” species’ shift in minimum elevations from 2020 to 2100 would occur more rapidly than the corresponding change in maximum elevations. Together, these changes would cause species’ distributions to shrink (Fig. 4a). However, the “increasing-distribution” species would have an unchanging minimum elevations but higher maximum elevations than in a previous temporal snapshot. These changes would broaden their distribution areas (Fig. 4b).

Figure 4.

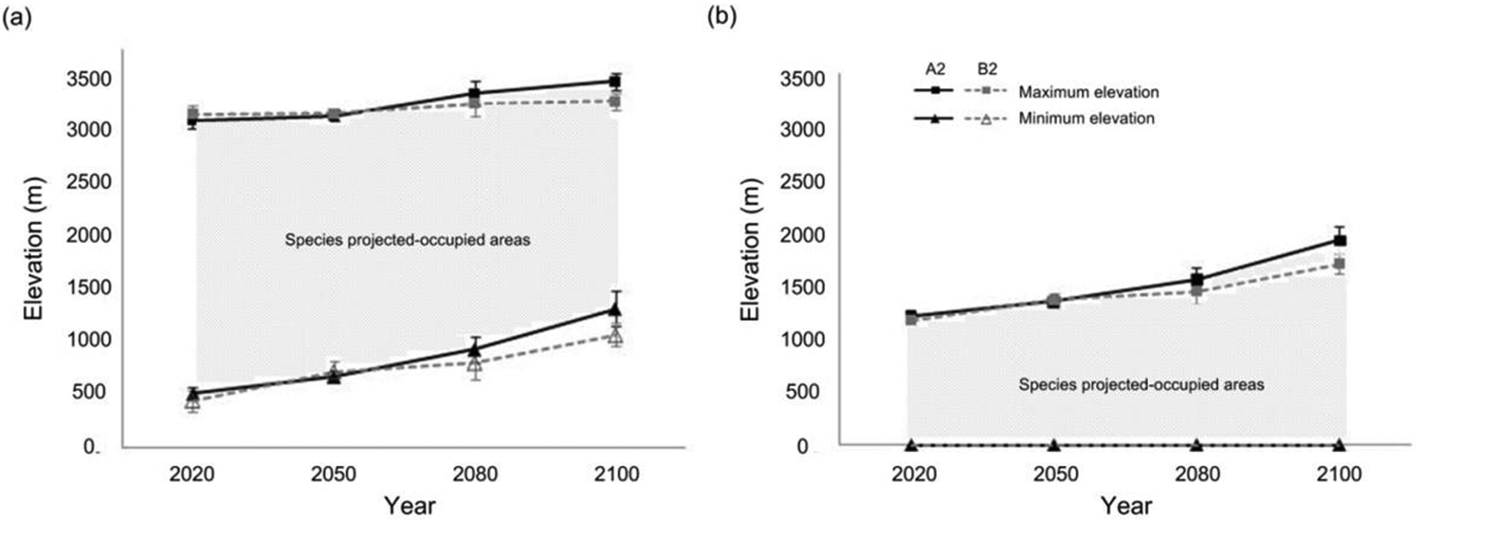
Changing trends in species’ projected-occupied maximum and minimum elevations. A species a with faster shift rates at minimum elevations than at maximum elevations would become a “decreasing-distribution” species (example: Taiwan Yuhina), and b those with a stable minimum elevation and an increasing maximum elevation would become an “increasing-distribution” species (example: Taiwan Hwamei) in response to climate change.

Discussion

Anthropogenic climate change is causing an increase in temperatures in Taiwan. Our results indicated that the 17 endemic bird species could have changes in their distributional range as a result of continued warming. All 17 species show changes in the upper elevational distributional limits shifting upward. The species with their medians higher than that of all of Taiwan would contract their lower-elevation boundaries with increases in temperature, while species with lower medians than that of all of Taiwan would extend their higher-elevation boundaries but not contract their lower boundaries. Because this work was performed on an island, we were able to examine the changes in the percentage of the distributional areas for each species.

As the temperature warms, the assemblages of species present in a given place are likely to change over time (Butler et al. 2007). This change in distribution raises several issues such as if these 17 endemic species will maintain competition within and among species and, more importantly, whether food resources (i.e., plant and insect taxa) will change in distribution at the same time or if the species change their diets. The interactions that lead to shifts in species distributions are complicated, and the differential species’ responses to temperature at multiple temporal and spatial scales are important areas for further investigation.

Potential expansion of species distributions

Using current environmental correlates of a species’ distribution to project its future occurrence by using five different models assumes that the species would exhibit the same behavior regardless of the type of habitat into which their distribution would expand. This assumption could certainly hold for some but not all species. This caveat must be considered in the case of the two species we examined the projections that showed expansion of their distributions. Indeed, the projected expansion may not be possible because of the type of habitat available. Additionally, land-use change could significantly imperil the ability of a species to expand its range (Lubowski et al. 2006, Feeley and Silman 2010). The models that we used in this study did not take into account the possibility of habitat change with elevation or that of land-use change.

The projected expansion could indeed be overly optimistic about places in which the species could inhabit. Various ecological and geographical barriers across space are other key points, in addition to climate, which affect species dispersal and distribution and habitat connectivity. For instance, the Styan’s Bulbul is currently restricted in distribution to a narrow area of eastern Taiwan. According to its projected geographical pattern, this species could expand to western Taiwan and become an “island-widespread” species instead of a “regionally-widespread” species. This expansion would require that the species increase its distribution across or around the Central Ridge Mountains of Taiwan in response to climate change. According to mitochondrial DNA (mtDNA) research on phylogeography in Taiwan show several species, such as Japalura swinhonis, Rana limnocharis, Gekko hokouensis, Mus musculus, Rhacophorus taipeianus, and Rhacophorus moltrechti, are divided into multiple small distributional populations by the Central Ridge Mountains (Hall and Holloway 1998, Cox and Moore 1999). This natural geographical barrier has obstructed gene flow among the populations, which further lead to species differentiation. Thus, the Central Ridge of Maintains plays a key role in keeping species from expanding their distributional ranges. This could be the case in the other two species examined here.

In addition, based on the projected distributions, the Styan’s Bulbul and the Taiwan Hwamei will likely occupy their original low-elevation habitats in addition to expanding to higher-elevation areas. At some point, however, the temperature could become so warm that the low-elevation heat could lead this species to abandon its original lowland habitats and move up in elevation.

Potential shifts in species distributions

The above-mentioned caveats notwithstanding, our results suggest possible elevational changes owing to increasing temperatures. Based on the observed records, the 17 species had ranges spanning 1480m in altitude for the species with the narrowest elevational range. The widest range is 3607m (Table 1). The species at these two extremes showed the same type of distributional change. The distribution of the species with the narrowest range (i.e. Formosan Magpie, Urocissa caerulea) is projected to decrease in size by 12.8% and 8.9% in the A2 and B2 scenarios respectively. The distributions of three other species had large decreases in size even though they had wider elevational ranges (Table 2). This result does not entirely agree with recent findings by Sekercioglu et al. (2008) and Harris and Pimm (2008), who mentioned that species with wider elevational ranges were less likely to be threatened by global climate change. In comparisons with La Sorte and Jetz’s findings (2010b), our results were much similar to simulated species being treated under a constrained vertical dispersal scenario than global montane birds in their study, but however, also not exactly the same. Their neutral patterns showed the simulated species with small vertical range extents (i.e. elevational range) contained median range losses of 100 per cent while of those species with large vertical range extents remained more of range sizes. The Taiwanese endemic bird species with small elevational range showed range decreasing, as La Sorte and Jetz’s findings, but some species may not be able to remain more range sizes, even through the species with large elevational range. Importantly, the Taiwanese endemic bird species do not fit their definition for montane bird species which may lead to the above differences. The specificity of distributional changes of island species when facing climate change is valuable to future exploration. The location and structure of mountain systems, especially an island like Taiwan, come out as a strong drive of extinction risk, which may beyond our expectations on species range shifts in a warming world.

The median elevation occupied by species, relative to the value of median elevation for Taiwan as a whole, exhibits a pattern of changes in the projected future distributions. The species with their median elevation lower than the overall medium of Taiwan are projected to expand their distributions, whereas those species with medians higher than that of Taiwan are projected to contract upwards. Current distributional median elevation of a species, therefore, appears to be a new index for assessing species changing distributions with future warming.

Species with a current conservation status defined as common, uncommon, or rare based on the number of grids in which a species was seen, as defined by Ko et al. (2010), show a decreasing trend of occupancy in the climate-change scenarios (Table 2). For instance, by 2100 in both the A2 and B2 scenarios, the distributions of two common species, the White-whiskered Laughing Thrush (Garrulax morrisonianus) and the Collared Bush-Robin (Tarsiger johnstoniae), would occupy smaller distributional ranges than that of the Mikado Pheasant (Syrmaticus mikado), which is currently a rare species. According to the species distributional projections with gradually decreases, species that are now common may become rare with warming temperatures. Moreover, species used in this study are endemic, and being projected a decreasing distribution of these species, on the other hand, means simultaneously the threat of global extinction. Hence, we cannot ignore future ecological responses of common species to the effects of climate change.

The census data used in this study were collected throughout the island with a given location being censused 2–3 years on average. At some locations, however, there are longer term data sets. At these locations species distributional changes are occurring in the expected direction, i.e. upward shift in elevation. For instance, census data collected from 1992 to 2006 in Yushan National Park show that the richness of bird species increased at altitudes above 3500 m, because six montane species were found to have a higher upper distributional limit in 2006 than in 1992 (Lee 2008a, 2008b). The recent warming trend in Taiwan is likely to have affected the range boundaries of bird species directly by converting previously uninhabitable territories into habitable ones, and those effects are actually larger than what we predict in this study.

Beside, the impacts of climate change on bird distributions between islands and continents could be different and is valuable to be further explored. Recent findings on California breeding land birds showed anticipated coastward and upslope shifts in distribution in response to a warming climate (Wiens et al. 2009). We did not find any coastward patterns in Taiwan according to the inventory of avifauna since 1993. The main reason is due to different factors causing daily or yearly temperature changes between islands and continents. Critical factors influencing all of Taiwan, not just the coastal regions as sea-surface temperature would do on bigger islands like Australia, or coastal areas on continents, like coastal regions of California. Taiwan is small enough that the sea-surface temperature will influence the temperature throughout the island. Other reasons, for instance, (i) high human population densities occur in coastal areas with less vegetation, and (ii) the 17 species we used are montane bird species that prefer areas for high forest density are both partially influencing Taiwanese species. Importantly, as expected, our results were still consistent with “localized hotspots” (i.e., a grid with high biodiversity) of change, especially in high-elevation areas.

Use of climatic scenarios

Ecological processes are usually gradual and can lead to continuous irreversible changes and evolutionary alterations. The four temporal snapshots in this study were selected to consider the possible reactions of species to a warming climate. Selecting several constant detection points (i.e., years) to evaluate climate-change impacts on species distributions in general may encourage vigilance among ecologists and conservation scientists. We must remember, however, that there are other forces than climate change that are acting on species. These forces include habitat destruction, invasive species, over hunting and harvesting, for example. A sharp threshold had been estimate to exist between habitat loss-patch occupancy and climate change, which pointed that the habitat (loss or destruction) threshold would occur sooner during climate change and species would suffer more risks (Travis 2003). Invasive (non-native) species were found more successful to adapt to rapid variations in climate change by being provided a large range of idealistic conditions, which would further lead to reduce biodiversity or wipe out completely large areas of natural vegetation (Tausch 2008, Willis et al. 2010). The risk to species from climate change, therefore, may be much higher than that envisioned by our projections due to synergistic effects with these other stresses. Given the available data our results provided the best projections currently available. If, however, more data are available on dispersal ability, land-use change in various habitat locations, adaptations exhibited by all species, evolutionary changes along with other data, more robust results of species projected distributions can be obtained and inform actions in support of conservation and management.

Conclusions

Observed and projected distribution patterns show that the species studied are predicted to react differently to an increasingly warming climate, either increasing or decreasing their distributions. Our study demonstrated that current distributional median elevation of a species can be a new index for assessing species changing distributions in future warming with those having elevational medians below the elevational median of Taiwan would most likely have expanding distributions and those with medians above the available medians would most likely have contracting distributions. Indeed, endemic species deemed currently as common but have medians above the available medium could decrease their distribution so much that they become rare. Therefore, the possible future ecological response of current common species to climate change should not be ignored. Current common species could possibly have contraction of ranges, which could mean it might become a rare species when facing an increasing temperature. Therefore, understanding the possible effects of climate change on natural systems indeed provides more robust conservation and management practices to be determined by ecologists and governments. Species present distributional projections can be further strengthened with following long-term monitoring, targeted field-based observations and interdisciplinary experiments.

Acknowledgments

We thank the Endemic Species Research Institute in Taiwan for providing species data, many volunteers and researchers for collecting field data, Robert J. Hijmans for helping to clarify the climatic data and the two reviewers for insightful comments and constructive criticism on the manuscript. A National Science Council Grant in Taiwan 097IPFA0100038 partially supported (to C.-Y. Ko) this study. This research was sponsored by National Science Council and Council of Agriculture, Taiwan.

References
Bradshaw WE, Holzapfel CM (2010) Light, time, and physiology of biotic response to rapid climate change in animals. Annual Review of Physiology 72: 147-166. doi: 10.1146/annurev-physiol-021909-135837
Butler JR, MacMynowski DP, Laurent C, Root TL (2007) Temperature-associated dynamics of songbird winter distributions and abundances. Journal of the Human Environment 36: 657-660. doi: 10.1579/0044-7447(2007)36[657:TDOSWD]2.0.CO;2
Cox CB, Moore PD (1999) Biogeography: an ecological and evolutionary approach, 6th edition. Blackwell Science Publications: 1–428.
Davis AJ, Jenkinson LS, Lawton JH, Shorrocks B, Wood S (1998) Making mistakes when predicting shifts in species range in response to global warming. Nature 391: 783-786. doi: 10.1038/35842
Emerson KJ, Bradshaw WE, Holzapfel CM (2010) Microarrays reveal early transcriptional events during the termination of larval diapause in natural populations of the mosquito, Wyeomyia smithii. PLoS One 5: e9574. doi: 10.1371/journal.pone.0009574
Feeley KJ, Silman MR (2010) Land-use and climate change effects on population size and extinection risk of Andean plants. Global Change Biology 16: 3215-3222. doi: 10.1111/j.1365-2486.2010.02197.x
Guisan A, Thuiller W (2005) Predicting species distribution: offering more than simple habitat models. Ecology Letters 8: 993-1009. doi: 10.1111/j.1461-0248.2005.00792.x
Hall R, Holloway JD (1998) Biogeography and geological evolution of SE Asia. Backhuys Publishers, 417 pp.
Hampe A, Petit RJ (2003) Conserving biological diversity under climate change: the rear edge matters. Ecology Letters 8: 461-467. doi: 10.1111/j.1461-0248.2005.00739.x
Harris G, Pimm SL (2008) Range size and extinction risk in forest birds. Conservation Biology 22: 163-171. doi: 10.1111/j.1523-1739.2007.00798.x
Hijmans RJ, Cameron SE, Parra JL, Jones PG, Jarvis A (2005) Very high resolution interpolated climate surfaces for global land areas. International Journal of Climatology 25: 1965-1978. doi: 10.1002/joc.1276
Hsu F-H, Yao C-T, Lin R-S, Yang C-C, Lai S-J (2004) Avian species composition and distribution along elevation gradient in the southern Taiwan. Endemic Species Research 6: 41-66.
Huntley B, Green RE, Collingham YC, Hill JK, Willis SG, Bartlein PJ, Cramer W, Hagemeijer WJM, Thomas CJ (2004) The performance of models relating species geographical distributions to climate is independent of trophic level. Ecology Letter 7: 417-426. doi: 10.1111/j.1461-0248.2004.00598.x
Jafari M, Zare Chahouki MA, Tavili A, Azarnivand H, Amiri Gh Zahedi (2004) Effective environmental factors in the distribution of vegetation types in Poshtkouh rangelands of Yazd Province (Iran). Journal of Arid Environments 56: 627-641. doi: 10.1016/S0140-1963(03)00077-6
Ko C-Y, Lin R-S, Ding T-S, Hsieh C-H, Lee P-F (2009) Identifying biodiversity hotspots by predictive models: a case study using Taiwan’s endemic bird species. Zoological Studies 43: 393-403.
Ko C-Y, Lin R-S, Lee P-F (2010) Macrohabitat characteristics and distribution hotspots of endemic bird species in Taiwan. Taiwania 55: 216-227.
Ko C-Y, Root TL, Lee P-F (2011) Movement distances enhance validity of predictive models. Ecological Modelling 222: 947-954. doi: 10.1016/j.ecolmodel.2010.12.001
Koh C-N, Lee P-F, Lin R-S (2006) Bird species richness patterns of northern Taiwan: primary productivity, human population density, and habitat heterogeneity. Diversity and Distribution 12: 546-554. doi: 10.1111/j.1366-9516.2006.00238.x
La Sorte FA, Jetz W (2010a) Avian distributions under climate change: towards improved projections. The Journal of Experimental Biology 213: 862-869. doi: 10.1242/jeb.038356
La Sorte FA, Jetz W (2010b) Projected range contractions of montane biodiversity under global warming. Proceedings of the Royal Society B 277: 3401-3410. doi: 10.1098/rspb.2010.0612
Lee P-F (2008a) Impacts of climate change on ecology. Science Development 424: 34-43.
Lee P-F (2008b) Climate change and ecological impacts. Journal of Forestry Research 15: 1-4.
Lee P-F, Ou H-Y, Tasi Y-Z, Luo M-L, Wang C-M (2010) Spatial databases serving as basic information sources for ecological engineers and researchers. Endemic Species Research Institute, Nantou, Taiwan, 1–95.
Lei F-M, Wei G-A, Zhao H-F, Yin Z-H, Lu J-L (2007) China subregional avian endemism and biodiversity conservation. Biodiversity and Conservation 16: 1119-1130. doi: 10.1007/s10531-006-9080-3
Lei F-M, Qu Y-H, Tang Q-Q, An S-C (2003) Priorities for the conservation of avian biodiversity in China based on the distribution patterns of endemic bird genera. Biodiversity and Conservation 12: 2487-2501. doi: 10.1023/A:1025886718222
Lin S-H, Liu C-M, Huang W-C, Lin S-S, Yen Z-H, Wang H-R, Kuo J-T, Lee Y-C (2010) Developing a yearly warning index to assess the climatic impact on the water resources of Taiwan, a complex-terrain island. Journal of Hydrology 390: 13-22. doi: 10.1016/j.jhydrol.2010.06.024
Lubowski RN, Bucholtz S, Claassen R, Roberts MJ, Cooper JC, Gueorguieva A, Johansson R (2006) Environmental effects of agricultural land-use change: the role of economics and policy. Economic Research Report No. (ERR-25). United States Department of Agriculture Press: 1–82.
Moles R, Hayes K, O’Regan B, Moles N (2003) The impact of environmental factors on the distribution of plant species in a Burrren grassland patch: implications for conservation. Biology and Environment: Proceedings of the Royal Irish Academy 103B: 139–145. doi: 10.3318/BIOE.2003.103.3.139
Myers N, Mittermeier RA, Mittermeier CG, da Fonseca GAB, Kent J (2000) Biodiversity hotspots for conservation priorities. Nature 403: 853-858. doi: 10.1038/35002501
Nakicenovic N, Alcamo J, Davis G, de Vries B, Fenhann J, Gaffin S, Gregory K, Grübler A, Jung TY, Kram T, Lebre La Rovere E, Michaelis L, Mori S, Morita T, Pepper W, Pitcher H, Price L, Riahi K, Roehrl A, Rogner H-H, Sankovski A, Schlesinger M, Shukla P, Smith S, Swart R, van Rooijen S, Victor N, Dadi Z (2000) Special Report on Emissions Scenarios: A Special Report of Working Group III of the Intergovernmental Panel on Climate Change, Cambridge University Press, Cambridge. http://www.grida.no/climate/ipcc/emission/index.htm
Parmesan C, Ryrholm N, Stefanescu C, Hill JK, Thomas CD, Descimon H, Huntley B, Kaila L, Kullberg J, Tammaru T, Tennent WJ, Thomas JA, Warren M (1999) Poleward shifts in geographical ranges of butterfly species associated with regional warming. Nature 399: 579-583. doi: 10.1038/21181
Parmesan C, Yohe G (2003) A globally coherent fingerprint of climate change impacts across natural systems. Nature 421: 37-42. doi: 10.1038/nature01286
Parry ML, Canziani OF, Palutikof JP, van der Linden PJ, Hanson CE (Eds) (2007) Climate Change 2007: Impact, Adaptation and Vulnerability. Contribution of Working Group II to the Forth Assessment Report of the Intergovermental Panel on Climate Change. Cambridge University Press, 976 pp.
Phillips SJ, Anderson RP, Schapire RE (2006) Maximum entropy modeling of species geographic distribution. Ecological Modelling 190: 231-259. doi: 10.1016/j.ecolmodel.2005.03.026
Pounds JA, Fogden MPL, Campbell JH (1999) Biological response to climate change on a tropical mountain. Nature 398: 611-615. doi: 10.1038/19297
Root LT, MacMynowski DP, Mastrandrea MD, Schneider SH (2005) Human-modified temperatures induce species changes: Joint attribution. Proceeding of the National Academy Science USA 102: 7465-7469. doi: 10.1073/pnas.0502286102
Root TL, Price JT, Hall KR, Schneider SH, Rosenzweig C, Pounds JA (2003) Fingerprints of global warming on wild animals and plants. Nature 421: 57-60. doi: 10.1038/nature01333
Root TL, Schneider SH (1993) Can large-scale climatic models be linked with multiscale ecological studies? Conservation Biology 7: 256–270. doi: 10.1046/j.1523-1739.1993.07020256.x
Schneider SH, Root TL (2002) Wildlife responses to climate change: North American Case Studies. Island Press, 437 pp.
Sekercioglu CH, Schneider SH, Fay JP, Loarie SR (2008) Climate change, elevational range shifts, and bird extinctions. Conservation Biology 22: 140-150. doi: 10.1111/j.1523-1739.2007.00852.x
Seo C, Thorne JH, Hannah L, Thuiller W (2009) Scale effects in species distribution models: implications for conservation planning under climate change. Biology Letters 5: 39-43. doi: 10.1098/rsbl.2008.0476
Smith JB, Schneider SH, Oppenheimer M, Yohe GW, Hare W, Mastrandrea MD, Patwardhan A, Burton I, Corfee-Morlot J, Magadza CHD, Fussel H-M, Pittock AB, Rahman A, Suarez A, van Ypersele J-P (2009) Assessing dangerous climate change through an update of the Intergovernmental Panel on Climate Change (IPCC) “reasons for concern”. Proceeding of the National Academy Science USA 106: 4133-4137. doi: 10.1073/pnas.0812355106
Tausch RJ (2008) Invasive plants and climate change. U.S. Department of Agriculture, Forest Servicem Climate Change Resource Center.
Thomas CD, Cameron A, Green RE, Bakkenes M, Beaumont LJ, Collingham YC, Erasmus BFN, de Siqueira MF, Grainger A, Hannah L, Hughes L, Huntley B, van Jaarsveld AS, Midgley GF, Miles L, Ortega-Huerta MA, Peterson AT, Phillips OL, Williams SE (2004) Extinction risk from climate change. Nature 427: 145-148. doi: 10.1038/nature02121
Travis JMJ (2003) Climate change and habitat destruction: a deadly anthropogenic cocktail. Proceedings of the Royal Society B 270: 467-473. doi: 10.1098/rspb.2002.2246
Walther G-R, Post E, Convey P, Menzel A, Parmesan C, Beebee TJC, Fromentin J-M, Hoegh-Guldberg O, Bairlein F (2002) Ecological responses to recent climate change. Nature 416: 389-395. doi: 10.1038/416389a
Wang B, Zou X, Zhu J (2000) Data assimilation and its applications. Proceeding of the National Academy Science USA 97: 11143-11144. doi: 10.1073/pnas.97.21.11143
Watson RT, Zinyowera MC, Moss RH (Eds) (1996) Climate Change 1995: Impacts, Adaptations and Mitigation of Climate Change. Contribution of Working Group II to the Second Assessment Report of the Intergovermental Panel on Climate Change. Cambridge University Press, 891 pp.
Wiens JA, Bachelet D (2010) Matching the multiple scales of conservation with the multiple scales of climate change. Conservation Biology 24: 51-62.
Wiens JA, Stralberg D, Jongsomjit D, Howell CA, Snyder MA (2009) Niches, models, and climate change: assessing the assumptions and uncertainties. Proceeding of the National Academy Science USA 106: 19729-19736. doi: 10.1111/j.1523-1739.2009.01409.x
Willis CG, Ruhfel BR, Primack RB, Miller-Rushing AJ, Losos JB, Davis CC (2010) Favorable climate change responses explains non-native species’ success in Thoreau’s woods. PLoS ONE 5: e8878. doi: 10.1371/journal.pone.0008878
Wu P-I, Liou J-L, Wu L-M (2008) Potential social and economic dimensional impacts of climate change in Taiwan. Global Change and Sustainable Development 2: 1-30. doi: 10.1073/pnas.0901639106